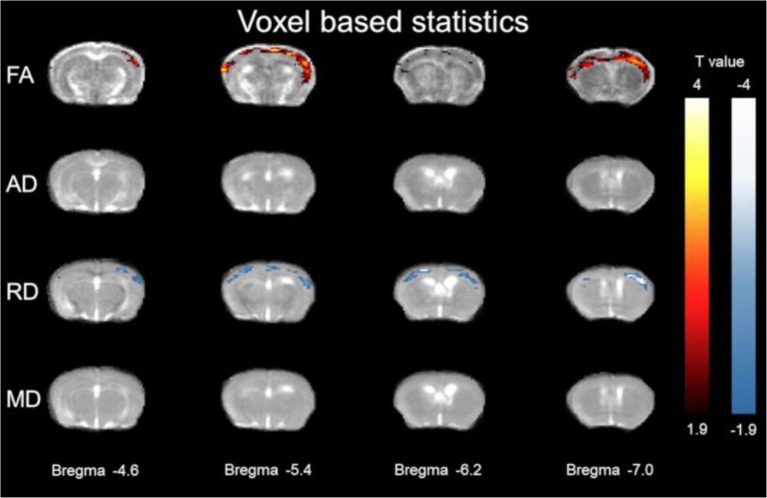
Figure 2.
Voxel based statistics of cortex. The y-axis representing rows are FA, (AD λ//), (RD λ⊥), and MD. Columns represent different Bregma locations −4.6, −5.4, −6.2, −7.0. Color bars represent positive t value differences (warm colors from 4 to 1.9) and negative t value differences (cool colors from −4 to −1.9).

