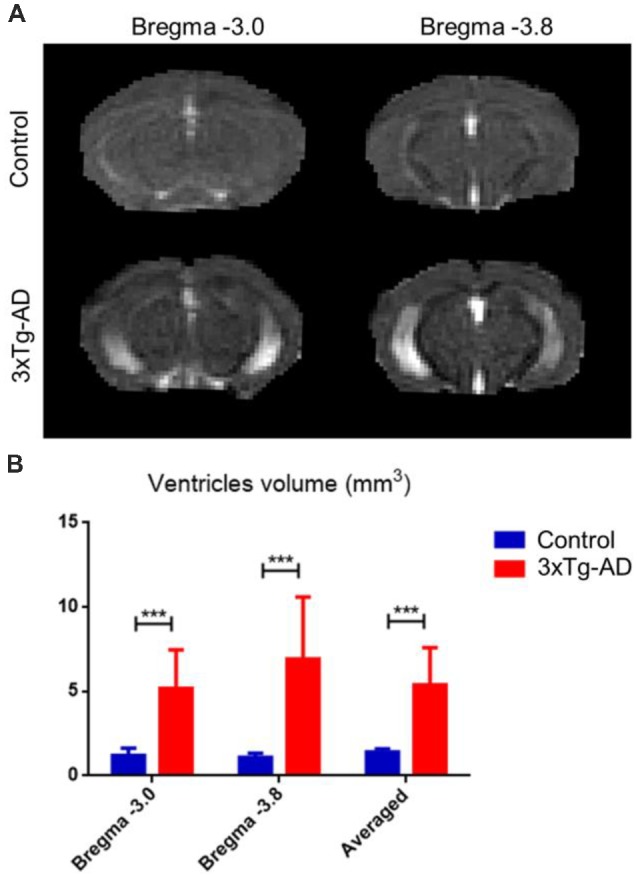
Figure 4.

Ventricular enlargement in 3xTg-AD compared with control mice. Using the RD λ⊥ map of each mouse minimizes partial volume of gray matter (GM) and white matter (WM) structures. (A) The 3xTg-AD group average ventricular enlargement along Bregma −3.0 and −3.8. (B) Bar plot of ventricle size in mm3 along Bregma −3.0, and −3.8 for 3xTg-AD (red) and control (blue). Ventricles were calculated by delineating the RD λ⊥ map of each ventricle to minimize the partial volume of GM and WM structures. The volume (mm3) of ventricles was then determined and compared. The asterisk *** represents highly significant P < 0.001 difference.
