Figure 5.
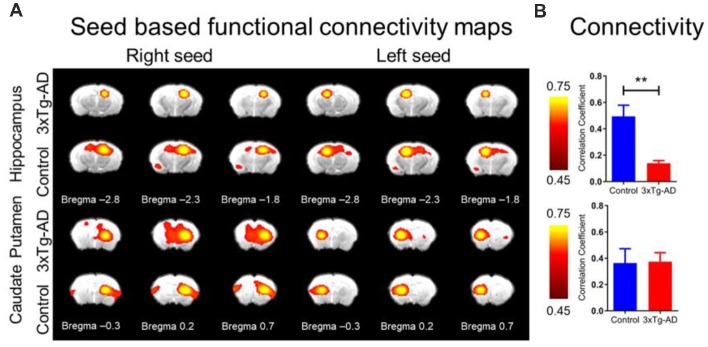
The rsfMRI connectivity change in 3xTg-AD compared with controls. (A) SBA in 3xTg-AD and control FC maps of hippocampus (upper panel) and CPu (lower panel) for right and left hemisphere seed. The ROI for hippocampus and CPu were derived from Franklin and Paxinos (2008) overlay Figure 1A. Note significantly reduced FC in left or right seed for 3xTg-AD in the hippocampus, but relatively unchanged for CPu. Color bar represents correlation coefficient from 0.75 yellow to 0.45 red. (B) Bar plots of average FC in hippocampus (upper) and CPu (lower) for the 3xTg-AD (red) and control (blue) groups. Color bar represents correlation coefficient. The asterisk ** indicates highly significant P < 0.01.

