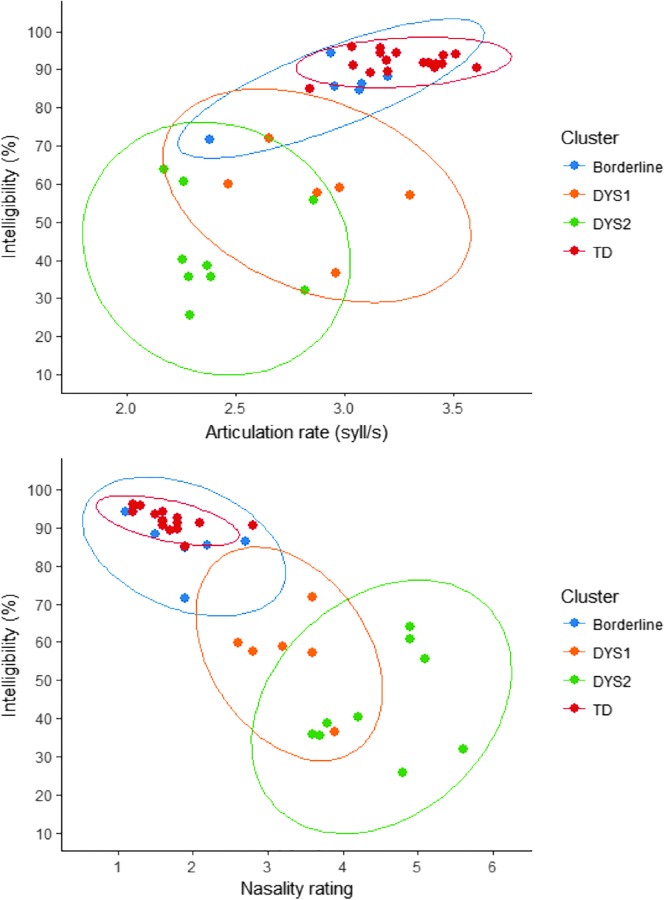
Figure 4.
Scatter plots showing the relation between intelligibility and articulation rate (top panel) and intelligibility and nasality rating (bottom panel) for children classified in each of the four clusters. DYS1 = Dysarthria 1; DYS2 = Dysarthria 2; TD = typically developing; syll/sec = syllables per second.

