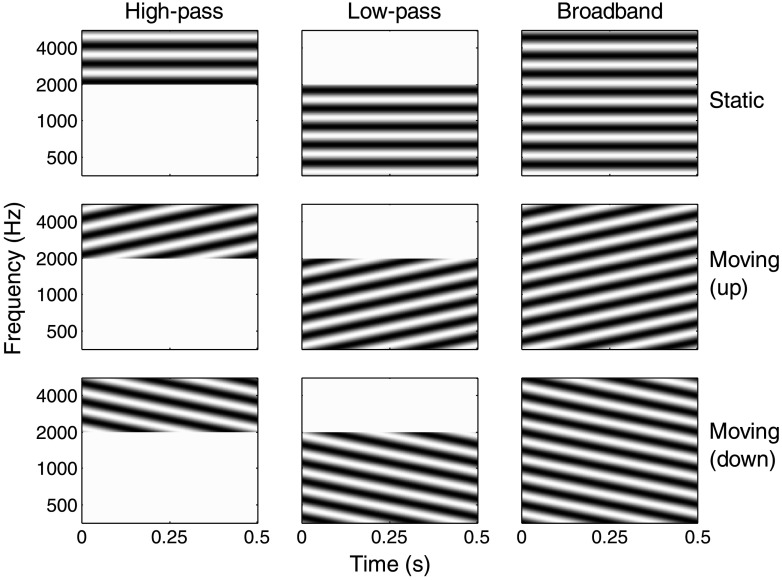
Figure 1.
Example spectrograms for the nine spectrotemporal modulation conditions tested in the experiment at 100% modulation depth (white area shows minimum magnitude; dark areas show maximum magnitude). Static stimuli (0 Hz) are shown in the top row, whereas upward- and downward-moving stimuli (4 Hz) are shown in the bottom two rows. Columns represent the different noise-carrier bandwidths tested.

