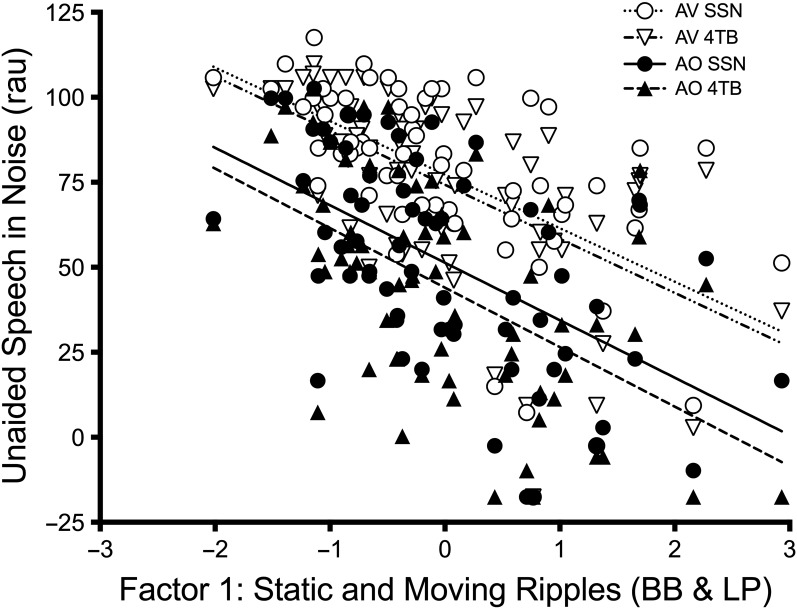
Figure 3.
Factor scores for Factor 1 (broadband [BB] and low-pass [LP]) are plotted against unaided speech perception scores. Individual data and linear regression lines are shown for the auditory-only (AO; filled symbols, bold lines) and auditory–visual (AV; open symbols, dotted lines) speech perception conditions in backgrounds of steady-state noise (SSN; circles) and four-talker babble (4TB; triangles).

