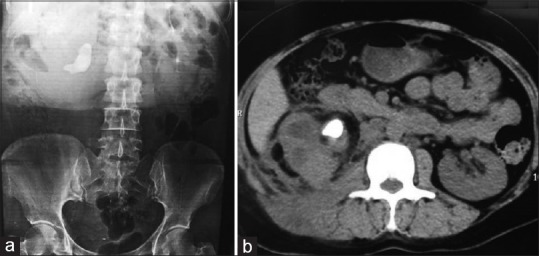
Figure 1.

(a) Intravenous pyelogram shows right staghorn calculus with nonfunctioning kidney while left renal function is normal and (b) axial non-contrast computed tomography scan image shows areas of low attenuation, parenchymal inflammation with staghorn calculus at pelvis
