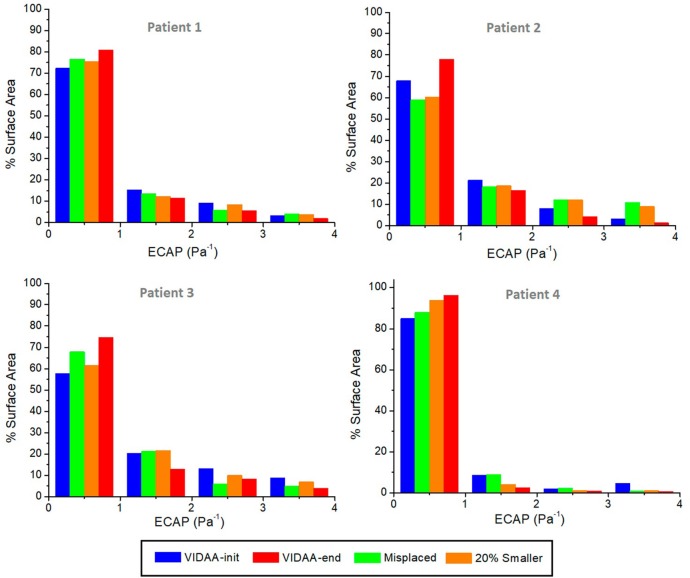
Figure 8.
Histograms of Endothelial Cell Activation Potential (ECAP) distribution (Pa−1) as a percentage of surface area for each patient and different device scenarios. VIDAA-init: device settings from morphological analysis and clinical recommendations; VIDAA-end: device settings after interactive manipulation in VIDAA; 20% smaller: device with a 20% smaller size than VIDAA-init; Misplaced: device with sub-optimal position and orientation.

