
FIGURE 3.
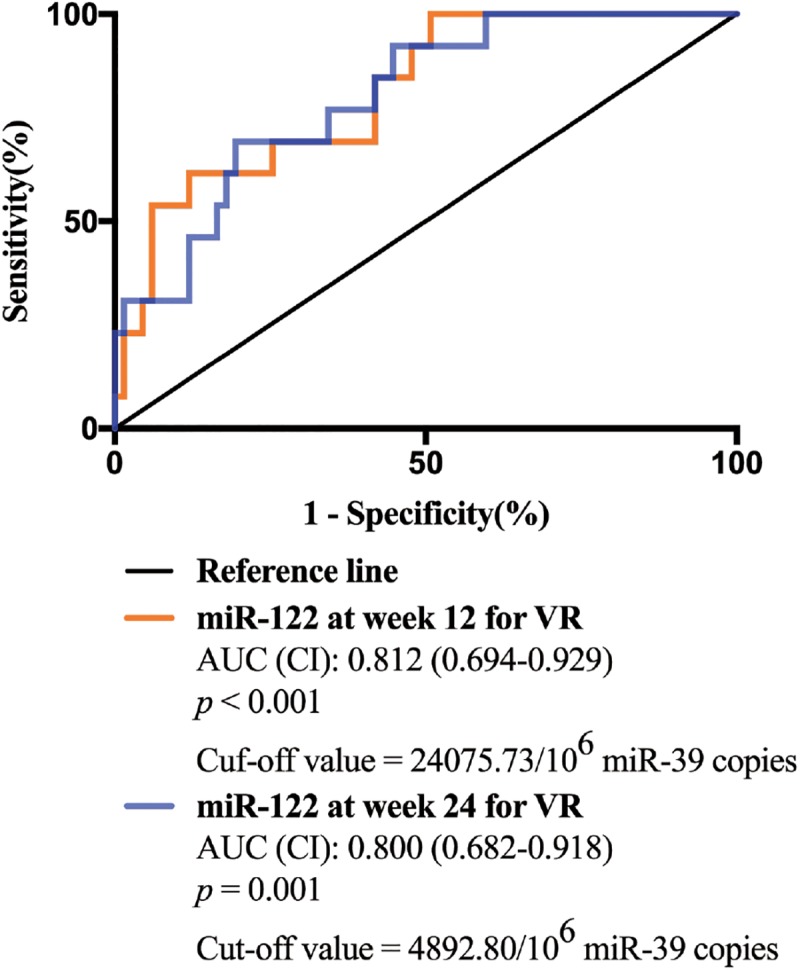
The receiver operating characteristic (ROC) curve analyses of the sensitivity and specificity of miR-122 levels in serum for the prediction of virological response at week 96. Both miR-122 levels at week 12 and week 24 were analyzed.
Official websites use .gov
A
.gov website belongs to an official
government organization in the United States.
Secure .gov websites use HTTPS
A lock (
) or https:// means you've safely
connected to the .gov website. Share sensitive
information only on official, secure websites.
The receiver operating characteristic (ROC) curve analyses of the sensitivity and specificity of miR-122 levels in serum for the prediction of virological response at week 96. Both miR-122 levels at week 12 and week 24 were analyzed.