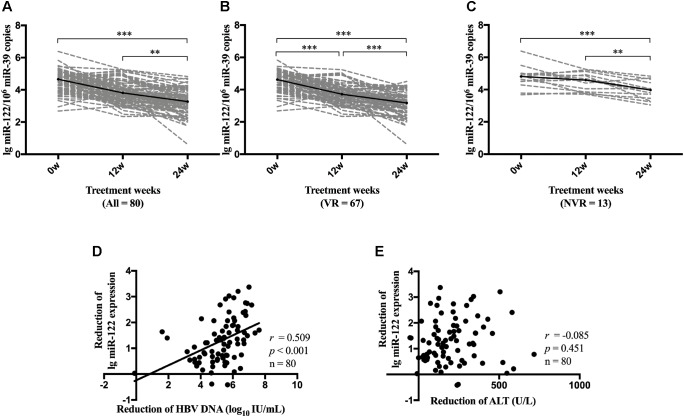
FIGURE 4.
Dynamic change of miR-122 level during NA therapy. Dynamic change of miR-122 levels among all patients (A), VR group (B) and NVR (C) group were evaluated. Spearman’s correlations between reduction of serum miR-122 levels and the reduction of viral load (D) or the reduction of ALT levels (E) were conducted at week 24. VR, virological response; NVR, non-virological response. ∗∗p < 0.01; ∗∗∗p < 0.001.

