Fig. 4.
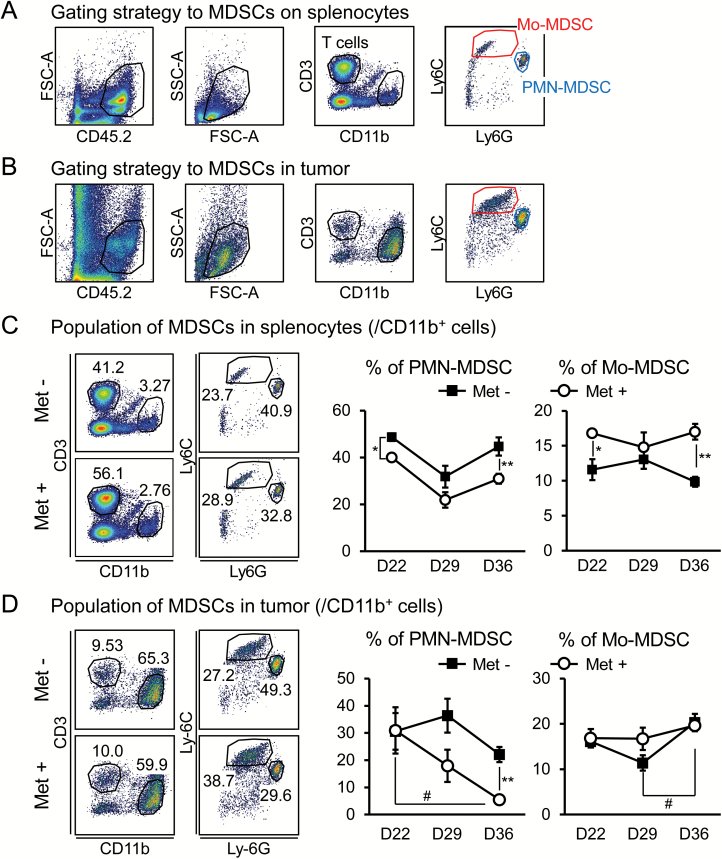
Decrease in PMN-MDSCs in spleens and tumors upon Met administration. The gating strategy to identify MDSCs in spleens (A) and tumors (B). PMN- and M-MDSCs were identified as CD11b+Ly6CmidLy6Ghigh and Ly6ChighLy6Gmid, respectively. The ratio of MDSCs to CD11b+ cells was monitored in spleens (C) and tumors (D) over time (n = 5). The results are representative of four independent experiments. *P < 0.05; **P < 0.01 by Student’s t-test (C and D). #P < 0.05 by one-way ANOVA (D).

