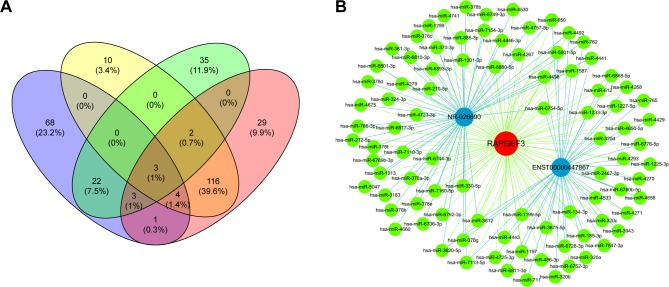
Figure 5.
(A) Venn graph shows the overlap of co-expressed mRNAs and target mRNAs predicted by ceRNA analysis. Purple: target mRNAs of NR-026690 predicted by ceRNA analysis; yellow: co-expressed mRNAs of NR-026690; green: target mRNAs of ENST00000447867 predicted by ceRNA analysis; red: co-expressed mRNAs of ENST00000447867. (B) lncRNA-microRNA-mRNA network. Blue: lncRNA; green: microRNA; red: mRNA; blue line: relationship between lncRNA and microRNA; green line: relationship between microRNA and mRNA.
Abbreviations: LncRNA, long noncoding RNA; ceRNA, competing endogenous RNA.

