
Figure 1.
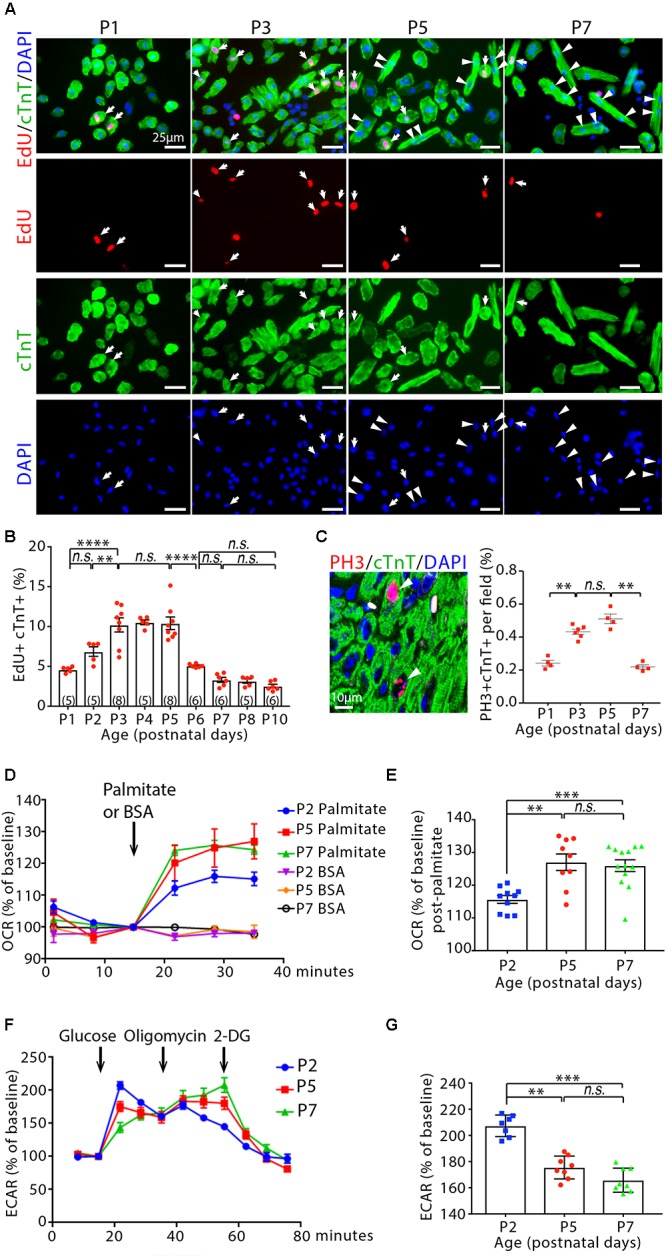
Cardiomyocyte cycling and metabolic profiling in infant mouse cardiomyocytes. (A) Isolated cardiomyocytes in DNA synthesis-phase were visualized by immunofluorescent microscopy using Click-iT EdU Alexa Fluor (red) and co-immunostaining with antibody against cardiac troponin T (cTnT, green). Arrows point to EdU+cTnT+ cells. Arrowheads point to binuclear cTnT+ cells. (B) Quantification of EdU+cTnT+ cells as percentage of total cTnT+ cells (∼1200 cTnT+ cells per sample). (C) Confocal images cardiomyocytes in mitotic phase as detected by co-immunostainings for phosphorylated histone H3 (PH3, red) and cTnT (green) on tissue sections, and quantification of PH3+cTnT+ cells as percentage of total cTnT+ cells analyzed per field. Arrows point to PH3+cTnT+ cells. (D–G) Isolated mouse cardiomyocytes from postnatal day 2 (P2), P5 and P7 heart ventricles were assessed with the Seahorse XF Analyzer. (D) Measurement and (E) quantification of mitochondrial oxygen consumption rate (OCR) with fatty acid stress test using palmitate versus BSA control. (F) Measurement and (G) quantification of extracellular acidification rate (ECAR) in the glycolysis stress assay. 2-DG (2-deoxyglucose) is a hexokinase inhibitor, which inhibits glycolytic pathway. P value was calculated using one-way ANOVA.