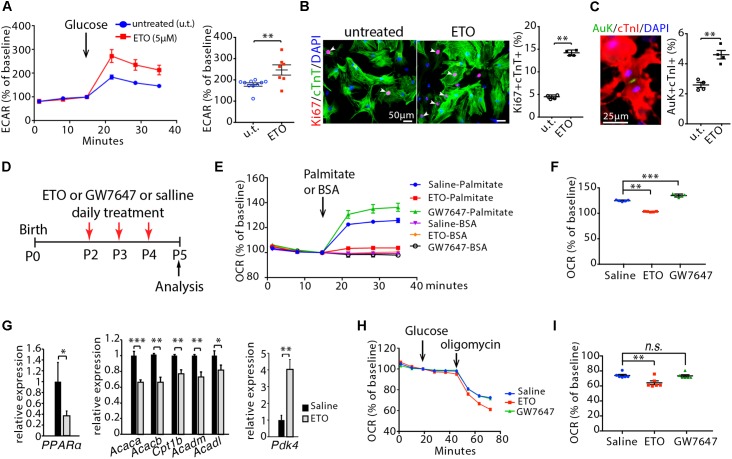
Figure 2.
Effects of etomoxir (ETO) and GW7647 treatment on cardiomyocyte metabolism. (A) Isolated neonatal mouse cardiomyocytes (P1) were cultured with medium containing ETO (5 μM) for 48 h. ECAR was measured in cardiomyocytes using the Seahorse XF Analyzer. (B) Cardiomyocyte proliferation were visualized by co-immunostaining for Ki67 (red) and cTnT (green) on cultured cardiomyocytes, and quantification of Ki67+cTnT+ as percentage of total cTnT+ cells analyzed. Arrows point to Ki67+cTnT+ cells. (C) Cardiomyocytes in cytokinesis were visualized by co-immunostaining for Aurora B kinase (Auk, green) and cTnI (red) on cultured cardiomyocytes, and quantification of Auk+cTnI+ as percentage of total cTnI+ cells analyzed. (D) Schematic of experimental design for experiments performed in panels (E–I). Infant mice were treated either with ETO or GW7647 or saline at P2, P3, and P4. Cardiomyocytes were isolated at P5 and processed for Seahorse analysis or gene expression analysis. (E,F) OCR was measured (E) and quantified in response to palmitate or BSA challenge (F). (G) Expression of indicated genes by qRT-PCR analysis of the mRNA of isolated heart ventricles at P5 (n = 4–6 per group). (H,I) OCR was measured in isolated cardiomyocytes at P5 (H) and quantified in response to glucose challenge (I). P value was calculated using Student’s t-test (A–C, G) and one-way ANOVA (F, I).

