
Figure 3.
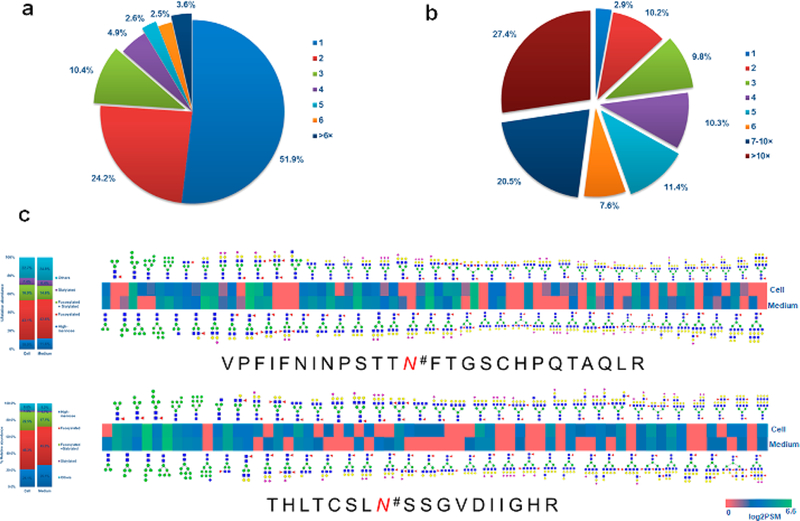
Heterogeneity of detected glycoproteins in CHO cell lysate and medium. (a) Distribution of glycosites per protein. (b) Distribution of glycans per glycosite. (c) Heat map of the differences in abundance of the subtypes of N-linked glycans between CHO cell lysate and medium on glycopeptide VPFIFNINPSTTN#FTGSCHPQTAQLR and THLTCSLN#SSGVDIIGHR. # indicates an N-linked glycosite.