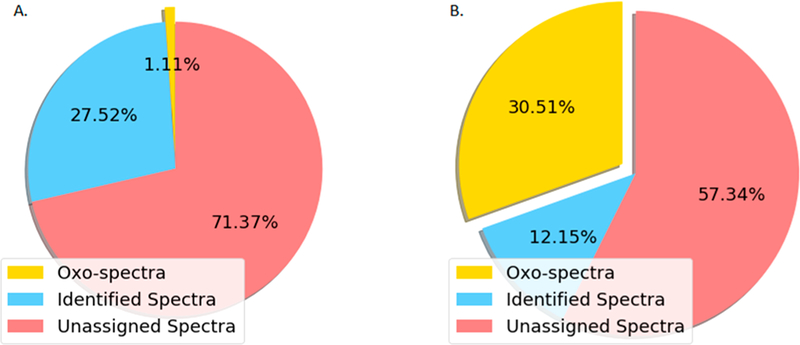
Figure 1.

Preliminary estimation of potential glycopeptides in the global and phosphoproteomic data sets from breast cancer xenograft tissues. The search results of global and phosphopeptide-enriched data sets are shown in parts A and B pie charts, respectively. The blue chart represents the proportion of identified peptides (A) and phosphopeptides (B). The red part presents the proportion of unidentified spectra. The yellow part represents the proportion of “oxo-spectra”.
