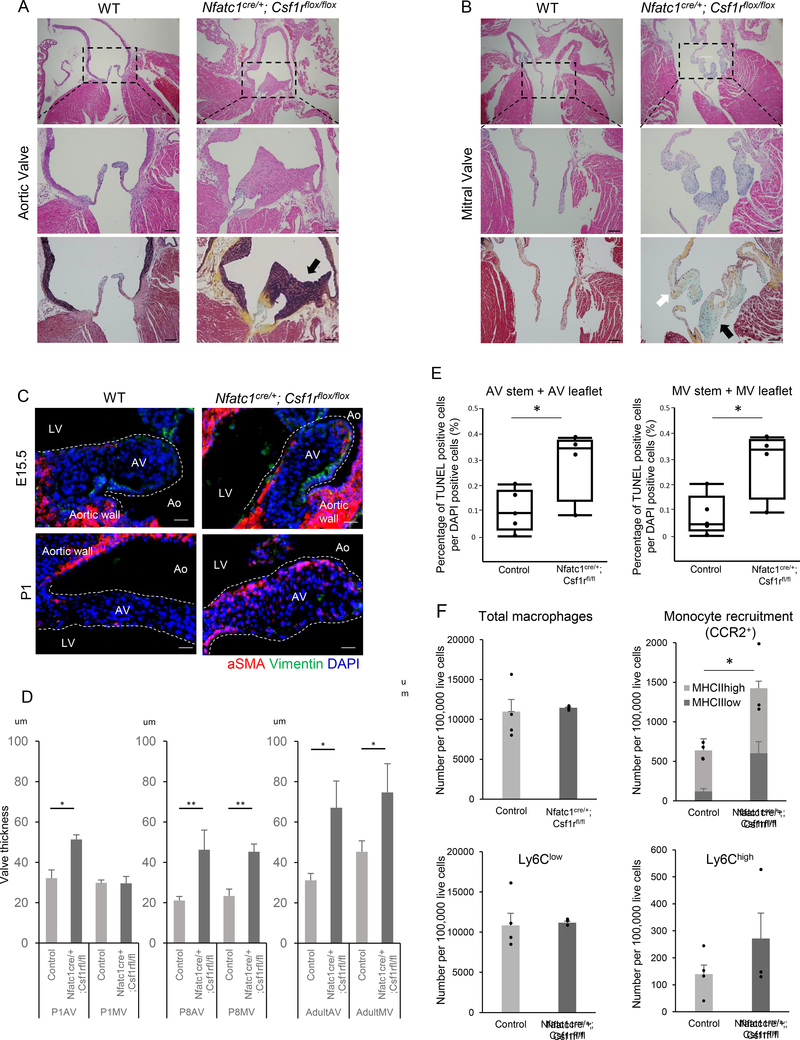
Figure 7. Valve abnormality in EcTMs-ablation mice.
A, B. H-E staining [top (4x), middle (10x)] and Movat’s pentachrome staining [bottom (10x)] of aortic (A) and mitral (B) valves from the control and Nfatc1cre/+; Csf1rfl/fl adult mice. A. Aortic valve of Nfatc1cre/+; Csf1rfl/fl is thick and hypercellular with ectopic elastic tissue (black staining, black arrow). B. Mitral valve of Nfatc1cre/+; Csf1rfl/fl is thick and hypercellular with collagen (yellow, white arrow)/mucin (blue, black arrow) deposition, suggesting a myxomatous degeneration. Scale bar = 100 μm
C. Immunofluorescent staining of aortic valves for αSMA (red) and Vimentin (green) at E15.5 and P1. Note the higher αSMA expression in valve interstitial cells of Nfatc1cre/+; Csf1rfl/fl valves. See also FigureS5B
D. Quantification of the thickness of aortic (AV) and mitral (MV) valves at P1, P8, and adult mutants and controls. Data represent mean ± SE. n = 2–4 at each data point. *P < 0.05 and **P < 0.001 by unpaired t-test.
E. Quantification of TUNEL-positive cells in the aortic valve (AV) stem and leaflet (left) and mitral valve (MV) stem and leaflet (right). Data represent mean ± SE. n=5 for control and 4 for mutants. *P < 0.05 by unpaired t-test.
F. Characterization of the macrophages in wild-type control and Nfatc1cre/+; Csf1rfl/fl adult hearts. Monocytes derived macrophages (CCR2+) are significantly increased in Nfatc1cre/+; Csf1rfl/fl, while the total number of macrophages are not significantly different. Data represent mean ± SE. n=4 for control and 3 for mutant. *P < 0.05 by unpaired t-test.

