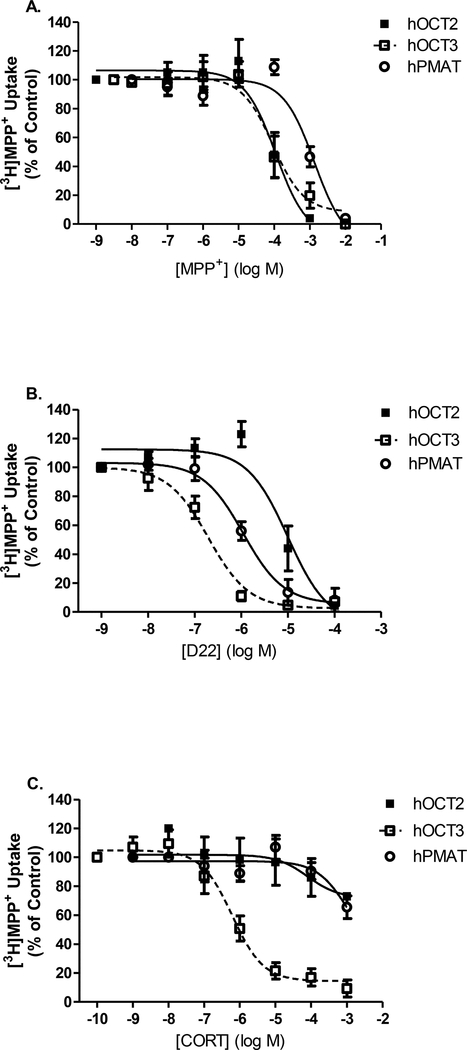
Fig. 5A-C. Low-affinity/high-capacity transporter cell line comparison of [3H]MPP+ uptake inhibition with reference compounds. A. MPP+, B. Decynium (D22), and C. Corticosterone (CORT).
Competition of 10 nM [3H]MPP+ uptake inhibition in human PMAT- (⭕, solid line), OCT2- (■, solid line), and OCT3-HEK (Ɥ, dotted line) expressing cell lines. Concentrations of unlabeled competing ligands ranged from 0 nM (control) to 1 or 10 mM for MPP+, or 100 μM for decynium-22, and 1 mM for corticosterone and are plotted on a log-scale. Uptake inhibition assays were performed at room temperature for 10 min. Data are fit to a non-linear regression analysis to determine IC50 estimations (refer to Table 4).

