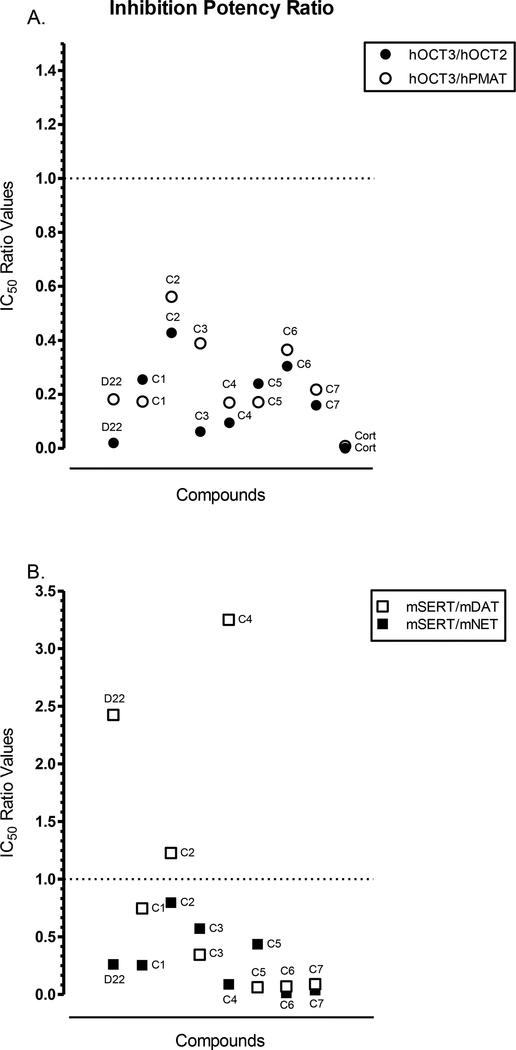
Fig. 7A-C.
Relative potency of corticosterone (Cort), parent D22, and D22 analogs (C1-C7). A. shows the IC50 ratio for the comparison of hOCT3 to hOCT2 (black, closed circles) and hPMAT (open circles); and B. shows the IC50 potency ratio for the comparison of mSERT to mDAT (open squares) and mNET (black, closed squares). A. The IC50 values, in μM (Table 4), for the competitive inhibition of [3H]MPP+ uptake by each compound at hOCT3 were divided by that of hOCT2 (●) or hPMAT (◯) to give a unitless ratio. Ratio values < 1 represent greater uptake inhibition at hOCT3, and values > 1 indicate greater potency at hPMAT or hOCT2. A lower range of the y-axis in depicted since all compounds had a ratio value that did not exceed 1. B. The IC50 values, in μM (Table 2), for each compound to displace [3H]citalopram at SERT were divided by the [3H]WIN 35428 displacement at DAT (⬜) and [3H]nisoxetine binding at NET (■) from mouse brain tissue preparations (as described earlier). For the unitless ratio obtained, values < 1 were more potent at mSERT and >1 more potent at mDAT or mNET. An IC50 ratio value of 1 indicates equipotency of the compound for both transporters of the comparison. A wider range of the y-axis in depicted to reflect the compounds with ratio values greater than 1.

