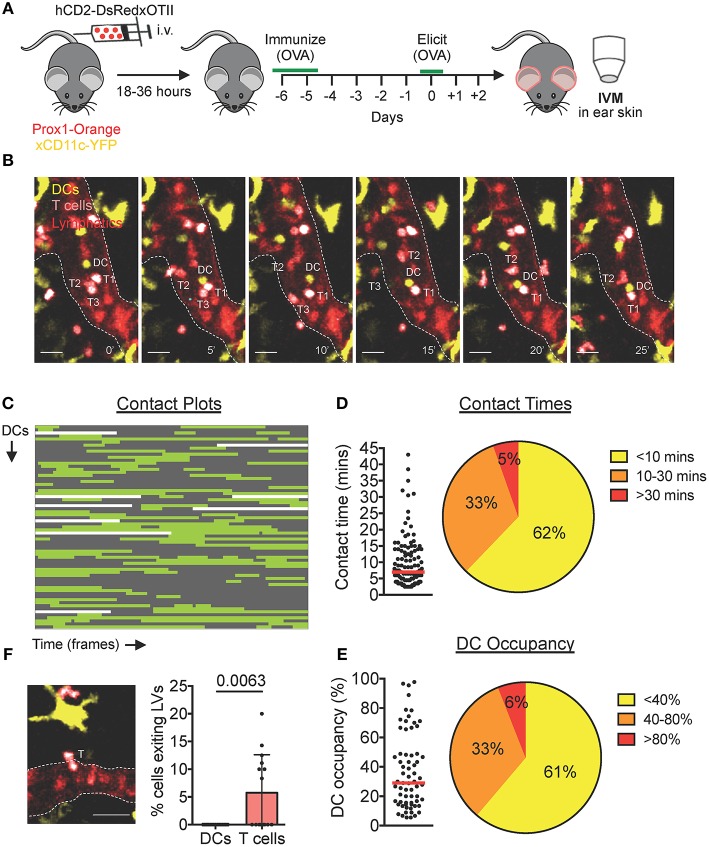
Figure 4.
Endogenous DCs interact with T cells inside lymphatic capillaries in DTH-inflamed mouse ear skin. (A–F) Intravital microscopy was performed in DTH-inflamed ear skin of Prox1-Orange×CD11c-YFP mice. (A) Schematic diagram of the experimental setup. (B) Time-lapse images of a YFP+ DC (DC, yellow) contacting DsRed+ T cells (T1 and T2) inside a lymphatic capillary (scale bars: 30 μm). A third T cell (T3) is shown exiting a lymphatic capillary. Times are shown in min. (C) Plots of contact between DCs and T cells inside lymphatic capillaries. Each line is a DC indicating contact (green) and no contact (gray) with T cells. Sixty
seven DCs, 111 contacts. (D) Quantitative analysis of contact times from (C) are shown individually and after classification into three contact time groups. (E) The occupancy of DCs by T cells from (C) are shown individually and after classification into three groups. Each dot in (D) and (E) represents a tracked cell. Medians are shown as red bars. (F) Intravital microscopy snapshot of a DsRed+ T cell (T) exiting a lymphatic capillary (scale bar: 30 μm) and quantification of the percentage of intralymphatic DCs or T cells that exited a lymphatic capillary during an imaging period. Each dot represents a movie analyzed. Mean and standard deviation are shown. Pooled data from 5 mice are shown.

