Figure 1.
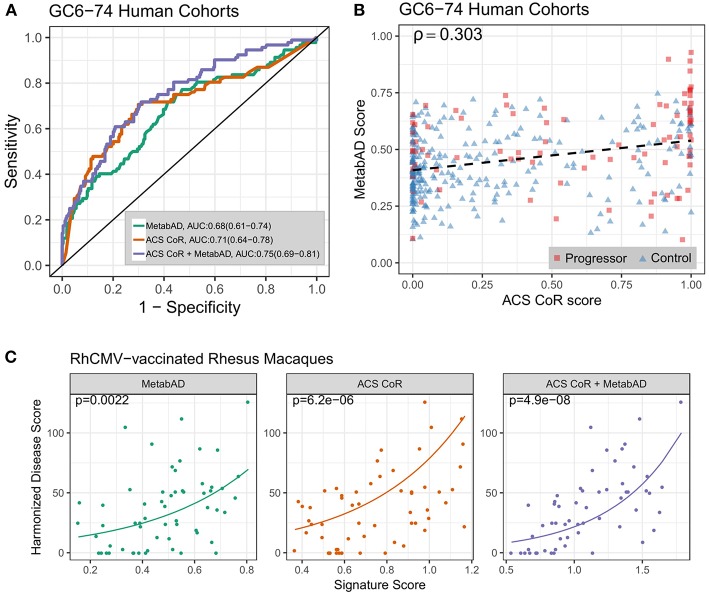
Performance of a combined transcriptomic and metabolomic signature of TB progression. (A) ROC curves for the ACS CoR transcriptomic signature alone, the MetabAD metabolomic signature alone, and the sum of ACS CoR + MetabAD. Legend shows signature AUCs and bootstrapped 95% confidence intervals around the AUC in parentheses. (B) Scatter plot of ACS CoR scores (x-axis) vs. MetabAD scores (y-axis). Progressor samples are shown as red squares, and Control samples are shown as blue triangles, with signature correlation indicated in the upper left (Spearman's ρ). The dashed black line indicates the linear fit of MetabAD vs. ACS CoR. (C) Scatter plots of individual and combined ACS CoR and MetabAD signature scores vs. harmonized disease score in two RhCMV-vaccinated rhesus macaque studies after M.tb challenge. Poisson regression was used to determine the relationship between signature score, measured 28 days post-challenge and harmonized disease score at time of necropsy. Solid lines represent Poisson regression fits to the harmonized disease score for MetabAD, ACS CoR and ACS CoR + MetabAD, respectively and p-values shown in the top left of each plot indicate significance of association between signature score and harmonized disease score.

