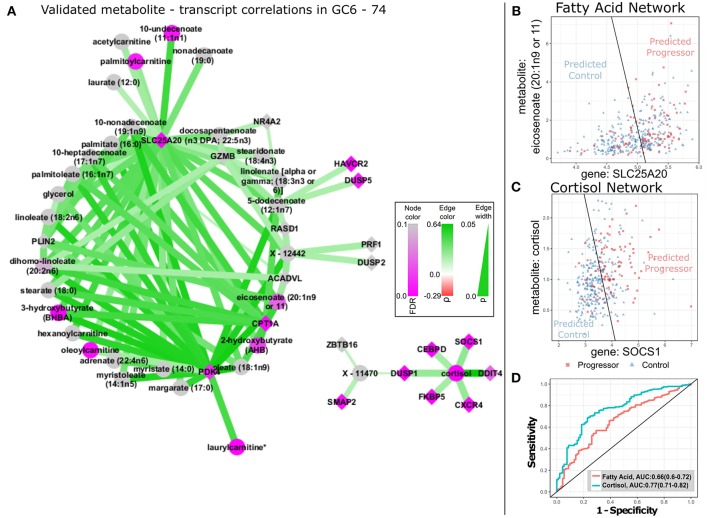
Figure 2.
TB-related biological networks inferred from correlations in GC6-74. (A) Network plot of selected transcript/metabolite pairs previously identified as correlated in KORA F4 that are also significantly correlated in GC6-74 samples. Transcript nodes are shown as diamonds, metabolite nodes as circles, with significant correlations indicated by edges linking transcripts and metabolites. Positive correlations between metabolites and transcripts are shown as green edges and negative correlations as red. Darker shades indicate stronger correlations (legend at center right). Transcripts and metabolites that showed significant association with TB progression are shaded in purple, with unassociated nodes shaded gray. Darker shades indicate more significant association, according to legend in bottom left. (B,C) Scatter plots of the levels of the optimal fatty-acid (SLC25A20/eicosenoate) and cortisol (SOCS1/Cortisol) transcript (y-axis)/ metabolite (x-axis) pairs in all GC6-74 samples. Progressor samples are shown as red squares, and control samples are shown as blue triangles. The optimal logistic regression classification boundary for each pair is shown as a black line, and text labels “Predicted Progressor” and “Predicted Control” indicate logistic regression binary predictions either side of the classification boundary. (D) ROCs for the fatty-acid and cortisol logistic regression pair models shown in (B,C) predicting all GC6-74 samples. AUCs for each model are shown in the legend, with 95% CIs in parentheses.

