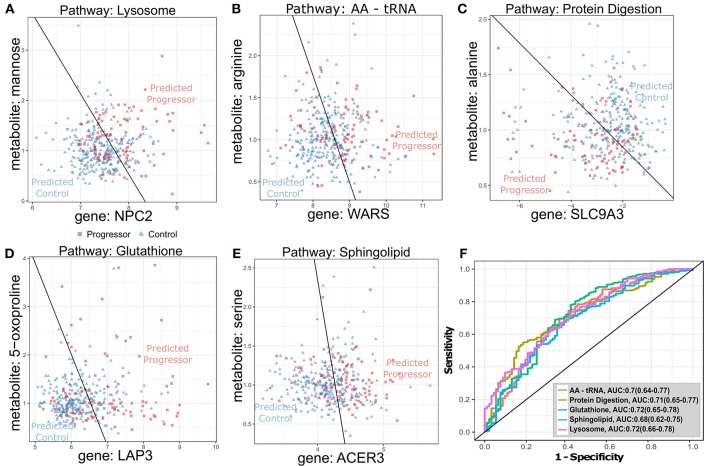
Figure 3.
Optimal transcript-metabolite pairs derived from canonical pathways predictive of TB progression in GC6-74 (A–E): Scatter plots of transcript (x-axis) and metabolite (y-axis) expression for transcript-metabolite pairs from canonical pathways significantly enriched for differential expression in all GC6-74 samples: Lysosome, AA-tRNA, protein digestion, glutathione and sphingolipid, respectively. Samples taken from TB progressors (Progressor) are shown as red squares, and samples from non-progressors (Control) are shown as blue triangles. The optimal logistic regression classification boundary is shown as a black line, and text labels “Predicted Progressor” and “Predicted Control” indicate logistic regression binary predictions either side of the classification boundary. (A–E) Scatter plots for the top pair from each pathway. (F) ROCs for each pair logistic regression model classifying all GC6-74 samples. AUCs for each model are shown in the legend, with 95% CIs in parentheses.

