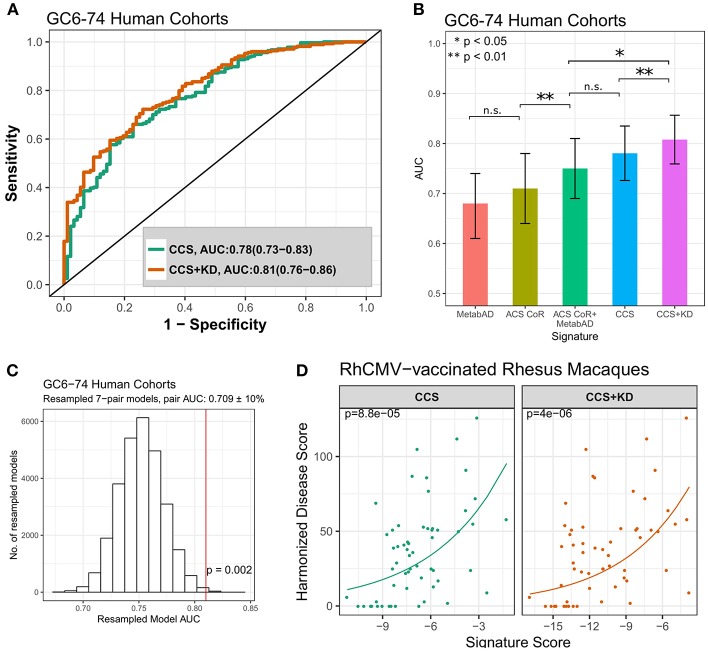
Figure 4.
Comparison of the pathway-derived signatures to previously discovered signature of risk of TB progression. (A) ROC curves for the pathway-derived CCS and CCS+KD signatures on all GC6-74 samples. (B) Comparison of the ROC AUCs of the external signatures (MetabAD and ACS CoR), the combined ACS CoR + MetabAD, and the pathway-based signatures (CCS, CCS+KD). Error bars represent 95% confidence intervals around the AUC. (C) Distribution of model AUCs from randomly resampled transcript-metabolite pairs with similar AUCs to pairs in the CCS+KD model. AUC of the CCS+KD signature is indicated by vertical red line. P-value indicates the proportion of resampled models with AUC > CCS+KD. (D) Scatter plots of CCS and CCS+KD signature scores vs. harmonized disease score in two RhCMV-vaccinated rhesus macaque studies after M.tb challenge. Poisson regression was used to determine the relationship between signature score, measured 28 days post-challenge and harmonized disease score at time of necropsy. Solid lines represent Poisson regression fits to the harmonized disease score for CCS and CCS+KD, respectively. P-values shown in the top left of each plot indicate significance of association between signature score and harmonized disease score.

