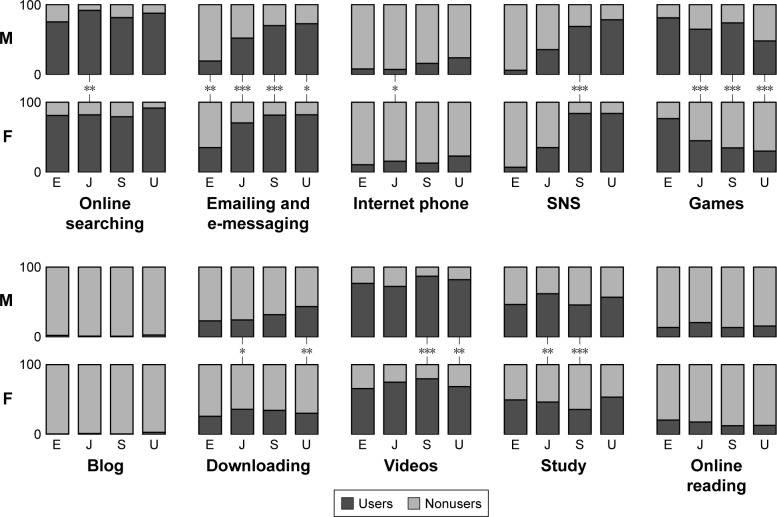
Figure 2.
Ratio of participants involved in ten online activities stratified by educational stages and sex: ratio of users (dark gray) and nonusers (light gray) are shown with bars.
Notes: The top and bottom rows in each panel correspond to M and F. Four bars in the top and bottom rows of each panel correspond to E, J, S, and U, from left to right. Results of χ2 test between males and females within each educational stage are indicated as follows: ***P<0.001; **P<0.01; *P<0.05.
Abbreviations: E, elementary; F, female; J, junior high school; M, male; S, senior high school; U, university.

