Figure 4.
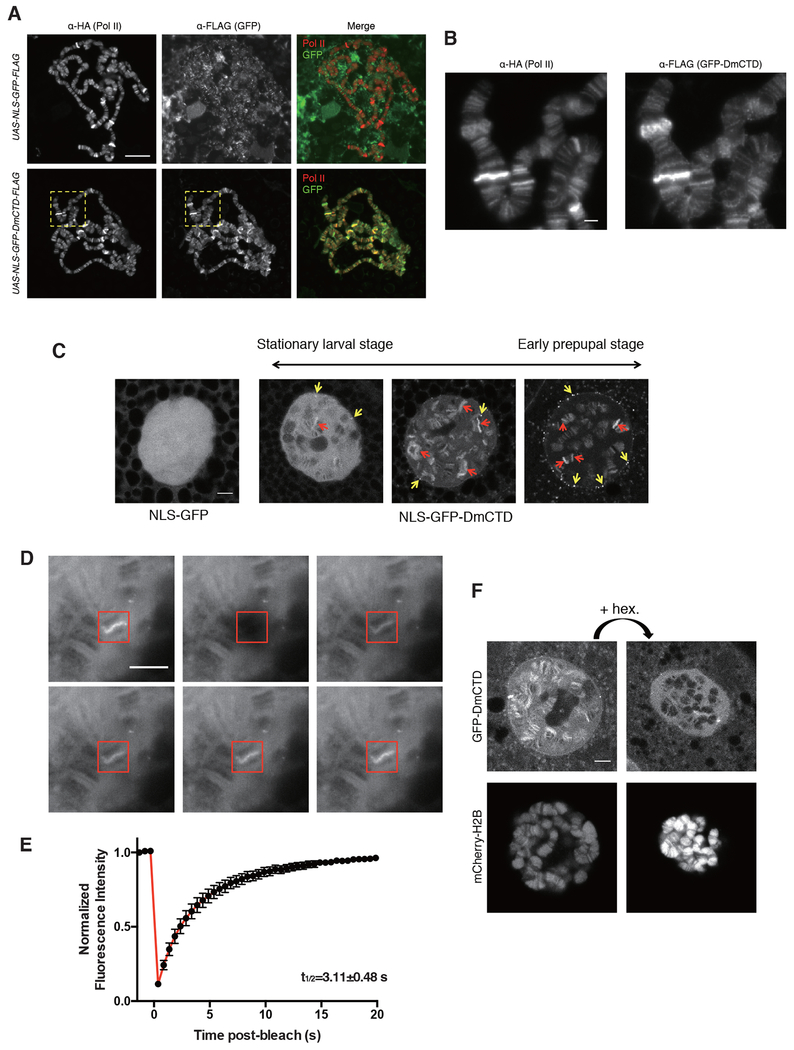
GFP-DmCTD is dynamically associated with sites of active transcription and sensitive to 1,6-hexanediol
(A) Indirect immunofluorescence detection of HA-tagged Pol II and FLAG-tagged NLS-GFP derivatives on fixed and spread polytene chromosomes. Salivary glands containing the polytene chromosomes were dissected from progeny derived from matings of Rpb1HA, da-GAL4 to UAS-NLS-GFP-DmCTD-FLAG or UAS-NLS-GFP-FLAG. See STAR methods for details.
(B) Magnified view of yellow boxes in (B).
(C) Single-stack confocal images of nuclei in live salivary glands expressing either NLS-GFP or NLS-GFP-DmCTD. >99% of cells expressing the NLS-GFP-DmCTD from the stationary larval stage have a range of appearances that resemble the left and middle panels whereas >99% cells from early prepupal stage have a range of appearances that resemble the middle and right panels. Examples represent the range of appearances observed. Red and yellow arrows indicate examples of chromosomal puffs and extrachromosomal foci that show enrichment of GFP-tagged CTD respectively.
(D and E) FRAP images (D) and average GFP intensity at GFP-DmCTD puffs following photobleaching (E). The red box indicates a bleached region. Data are from 15 puffs in 15 different salivary glands. Error bars represents SEM.
(F) Treatment with 1% 1,6-hexanediol disrupts the association of GFP-DmCTD with chromosomes. Fluorescence from mCherry-labeled H2B indicates that the chromosomes remain intact following 1,6-hexanediol treatment. Each image is a single Z stack.
Scale bar in (A) represents 50 μm, all other scale bars represent 5 μm.
See also Figure S3 and S4 and Movie S1, S2 and S3.

