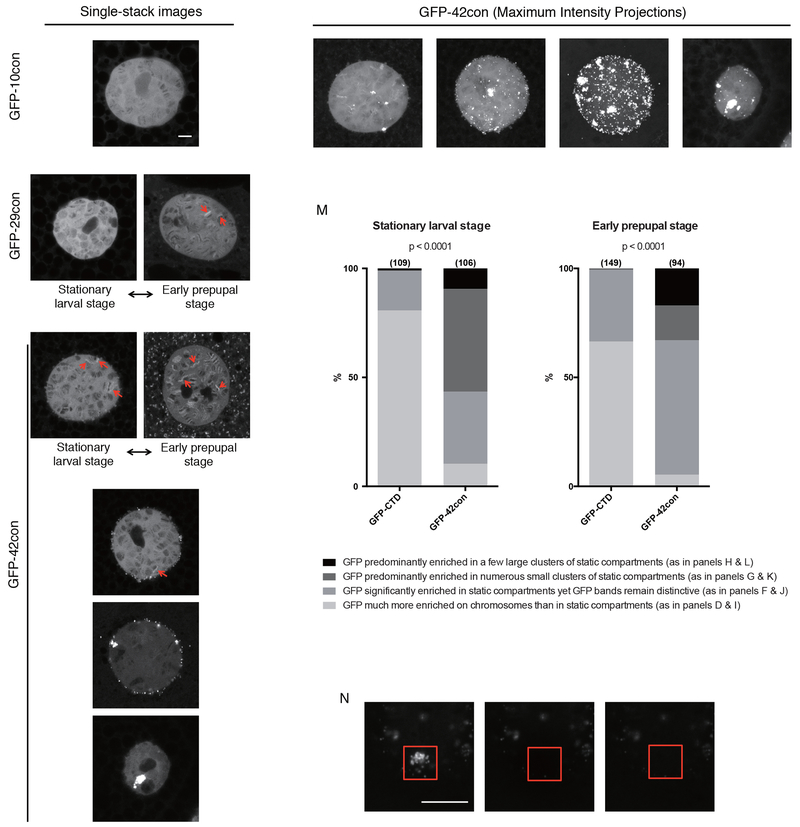
Figure 5.
Varying the CTD sequence composition alters its distribution in the nucleus(A to H) Single-stack confocal images of nuclei in live salivary glands expressing NLS-GFP-10con (A), NLS-GFP-29con (B and C) and NLS-GFP-42con (D to H). B and D were collected from the stationary larval stage whereas C and E were collected from the early prepupal stage. Examples depicted in A, F, G and H can be observed in both stages. Red arrows indicate bright puffs that show GFP enrichment over the surroundings.
(I to L) Maximum intensity projections of the same nuclei shown in D, F, G and H, respectively.
(M) GFP-42con cells are more prone to partition in extrachromosomal foci, many of which do not recover after photobleaching as shown in (N). Sample sizes are indicated in parentheses. Darker shades of gray indicate that more CTD associates with static compartments than with chromosomes. p<0.0001, two-sided chi-squared tests.
(N) FRAP images on a cluster of GFP-42con foci. Red box indicates bleached region.
All scale bars represent 5 μm.
See also Figure S3 and S5 and Movie S4.

