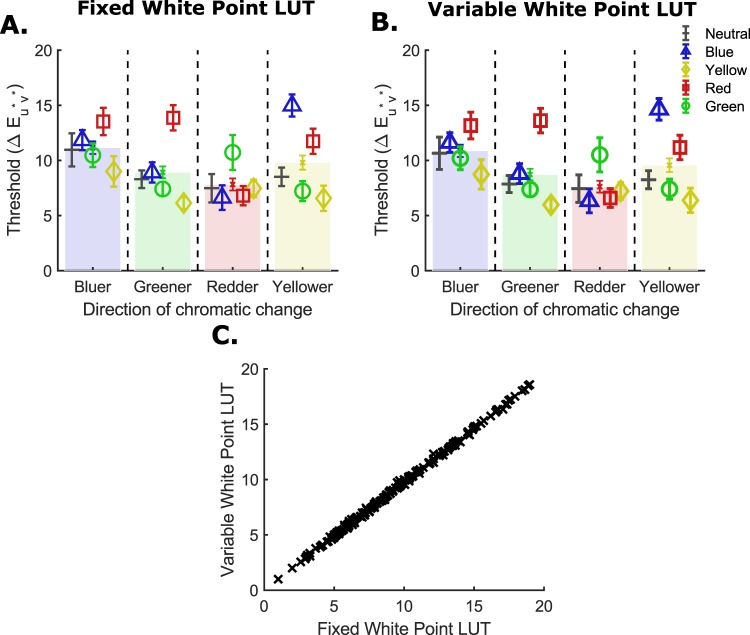
Figure C2.
Thresholds calculated using the variable white point LUTs. (A) Thresholds calculated using the fixed white point LUT plotted in a compact format for comparison. (B) Thresholds calculated using the variable white point LUT. Transparent bars represent the main effect of chromatic direction of change in both (A) and (B). They are the thresholds for each chromatic direction averaged over reference illuminations. (C) Scatter plot of the threshold data calculated using the variable white point LUTs plotted against threshold data calculated using the fixed white point LUTs. All thresholds are plotted for each participant, with 20 thresholds per participant and 180 points in total.

