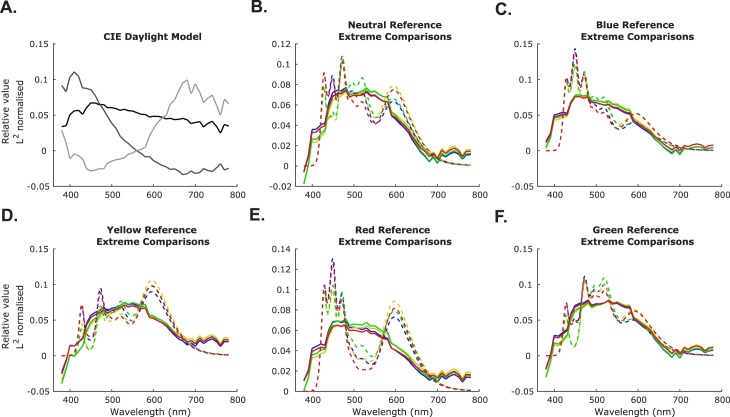
Figure E1.
Fitting the three-component CIE daylight model to the experimental illuminations. (A) The L2 normalized CIE daylight basis functions. S0 is in black, S1 is in medium gray, and S2 in light gray. (B–F) The measured spectral power distributions of the most extreme comparison illuminations (20 ΔEu*v* away, colored according to illumination-change direction) used in the experiment for each reference illumination condition (dotted lines) compared with the recovered spectral power distributions of these illuminations obtained from fitting the three-component CIE daylight model (solid lines).

