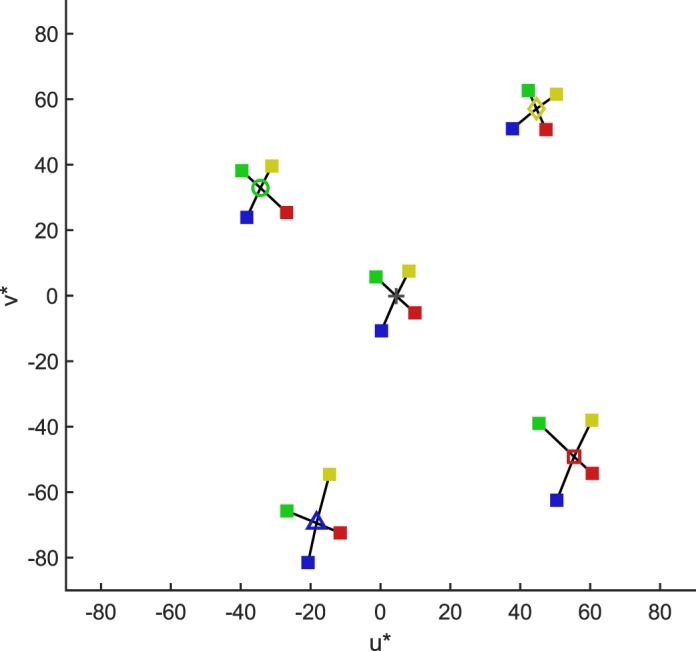
Figure 5.

Mean thresholds (across participants) plotted in the CIELUV chromaticity plane. The cross and hollow markers correspond to the different reference illumination conditions (+ neutral, ▵ blue, ○ green, □ red, ⋄ yellow). The solid square symbols represent the threshold locations for the different illumination-change directions (color-coded). The connecting black lines are drawn in to facilitate comparisons of threshold magnitudes between directions.
