Figure 6.

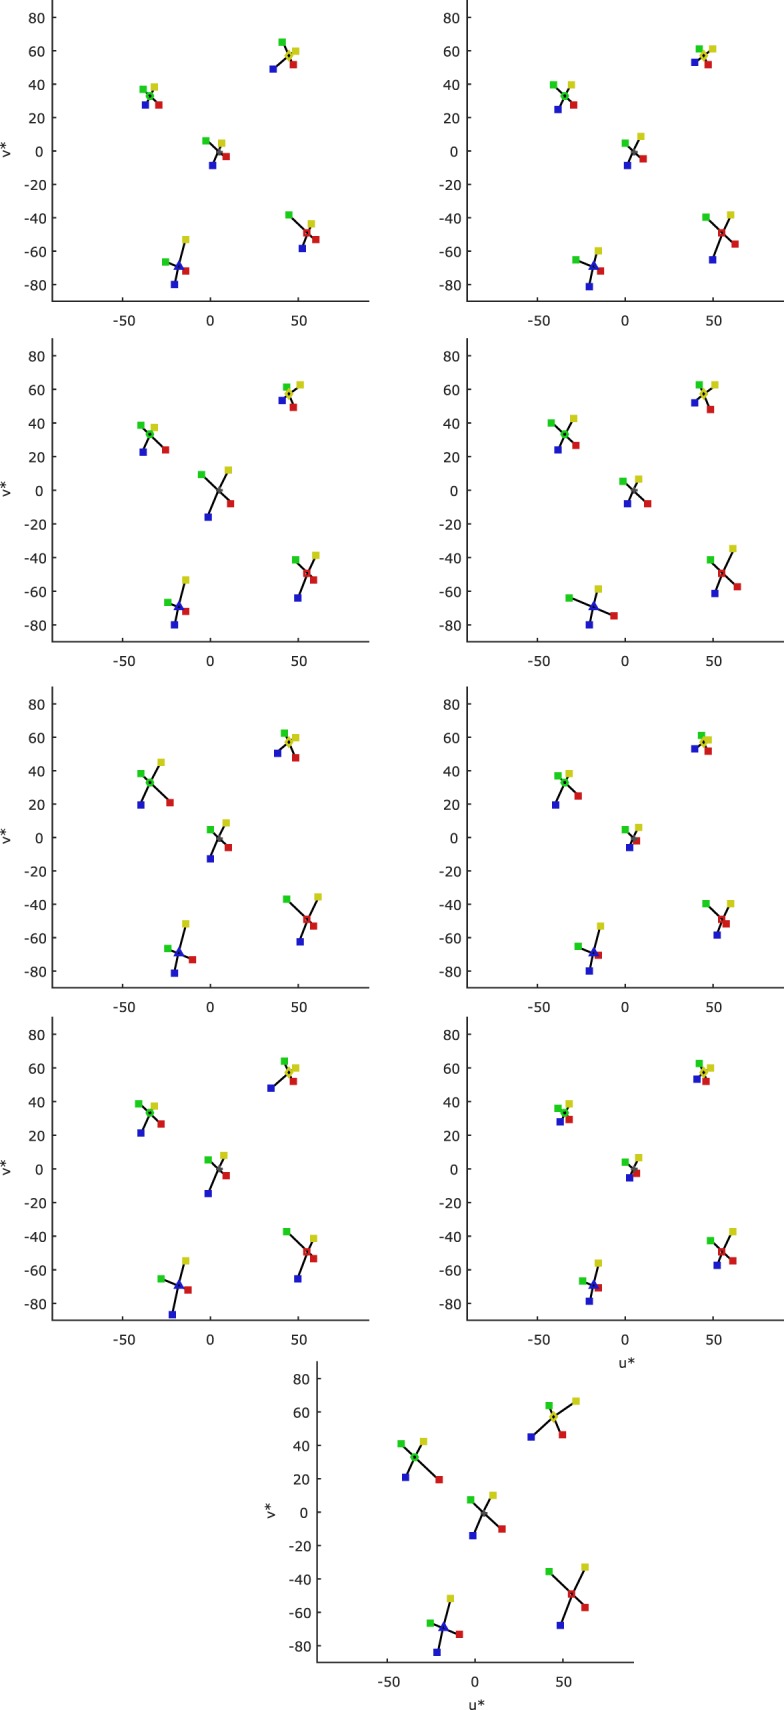
Thresholds for each individual participant (one participant per plot) plotted in the CIELUV chromaticity plane. For interpretation of symbols, see Figure 5.

Thresholds for each individual participant (one participant per plot) plotted in the CIELUV chromaticity plane. For interpretation of symbols, see Figure 5.