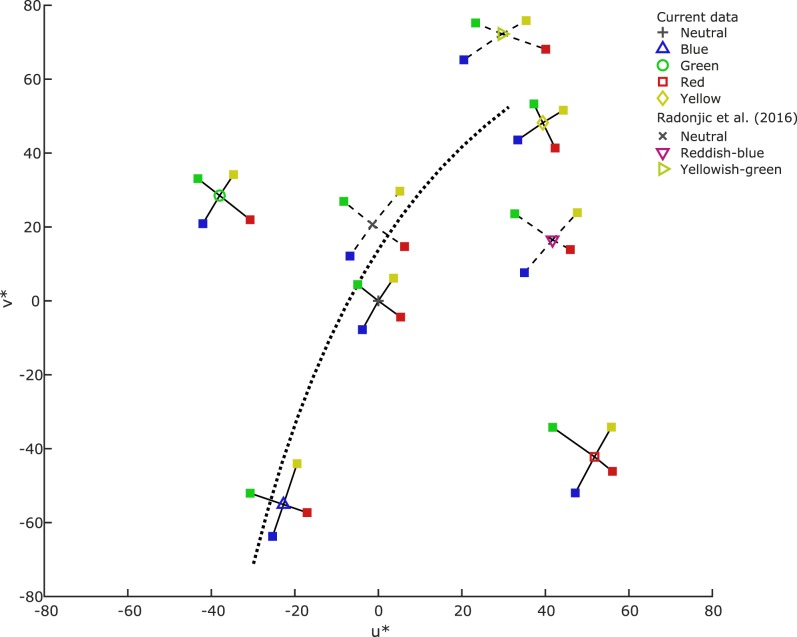
Figure 7.
Mean thresholds (across participants, calculated using the image mean lookup tables) for the current study (solid lines) and the data in Radonjić, Pearce et al. (2016) (dashed lines) plotted in the CIELUV chromaticity plane. Black dotted line shows the Planckian locus (an estimate of the daylight locus). For interpretation of symbols, see Figure 5.

