
Figure 1.
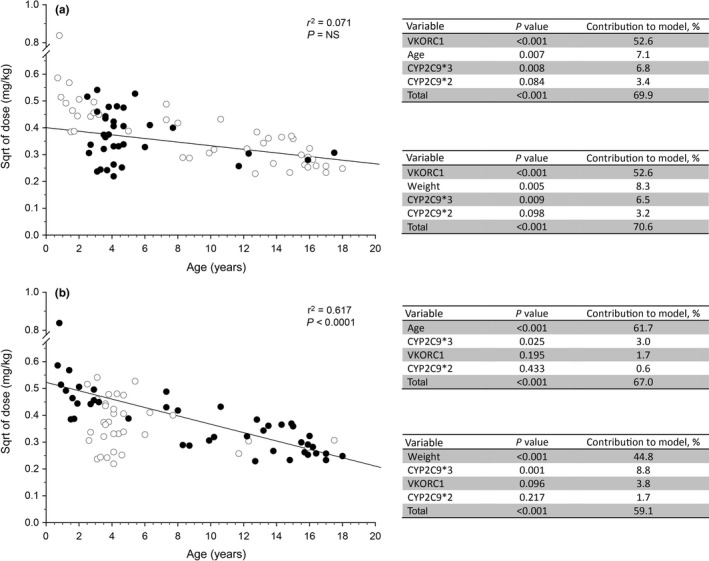
Subgroup analysis of the relative contribution of genetic and nongenetic factors to observed variability in warfarin dose required to achieve a stable International Normalized Ratio in children. Data from a previously published study11 were used to determine if “developmental” factors may be obscuring the genotype‐phenotype relationships expected from adult studies. Study participants with Fontan circulations were noted to be more homogenous with respect to age compared with participants with non‐Fontan indications for warfarin treatment. (a) The relationship between weight‐corrected dose (normalized by taking the square root (sqrt)) as a function of age is presented for all participants in the study (open symbols), and Fontan patients are highlighted as solid black symbols. Statistical analysis as described in the original study was applied to the Fontan subgroup, and the results are presented in tables adjacent to the plot; substitution of “age” with “weight” does not alter the observation that genetic factors account for more of the variability than developmental factors. (b) The relationship between weight‐corrected dose as a function of age is presented for all participants in the study as described above, and study participants receiving warfarin for indications other than a Fontan circulation are highlighted as solid black symbols. Statistical analysis as described in the original study was applied to the non‐Fontan subgroup, and the results are presented in the tables adjacent to the plot. A significant relationship (r 2 = 0.617, P < 0.0001) exists between dose and age, with the contribution of “age” accounting for the majority of the observed variability in dose. NS, not significant; VKORC1, vitamin K oxidoreductase complex 1.