Figure 2.

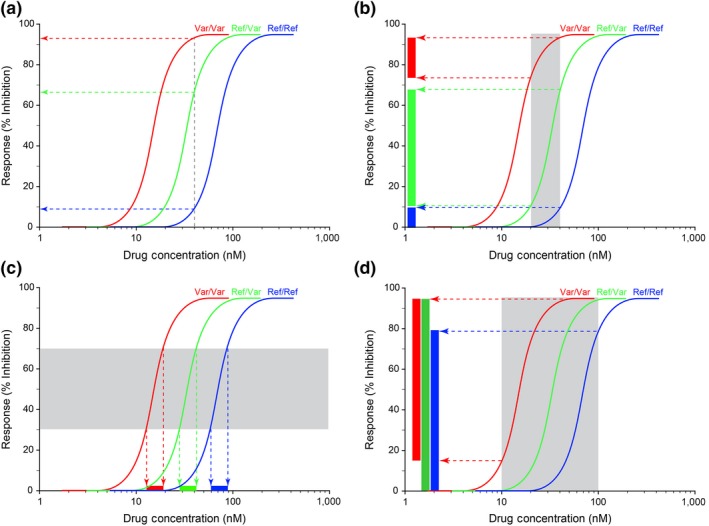
Rationale for the Respose→Exposure→Dose paradigm. The relationship between drug concentration (as a surrogate for exposure) and the observed response for each genotype (homozygous reference sequence (Ref/Ref; blue curves, dotted lines and rectangles), homozygous variant (Var/Var; red curves, dotted lines and rectangles), and heterozygous genotype (Ref/Var; green curves, dotted lines and rectangles)), can be visualized as three parallel concentration‐response curves. (a) Each copy of the variant allele for a theoretical drug target is associated with an approximately twofold decrease in target expression, as has been reported for the ‐1639G>A allele for vitamin K oxidoreductase complex 1 (VKORC1), the target of warfarin action.57 The observed response at a given drug concentration is a function of the drug target genotype, and differs for each genotype. (b) Similarly, a twofold range of concentrations (gray shaded area) will be associated with a range of responses that differ by drug target genotype (rectangles adjacent to the y‐axis colored according to the corresponding genotype curve). (c) To achieve the same therapeutic goal across the population, each group as defined by drug target genotype or level of expression will require a unique range of exposures. (d) When genetic variation in drug clearance results in a wide range of exposures for a given dose, the contribution of variation in drug target to the observed variability in drug response is obscured by the variability in exposure and cannot be detected. The shaded area is analogous to the 10‐fold range of area under the concentration‐time curve (AUC) reported for atomoxetine in the product label.
