
Figure 2.
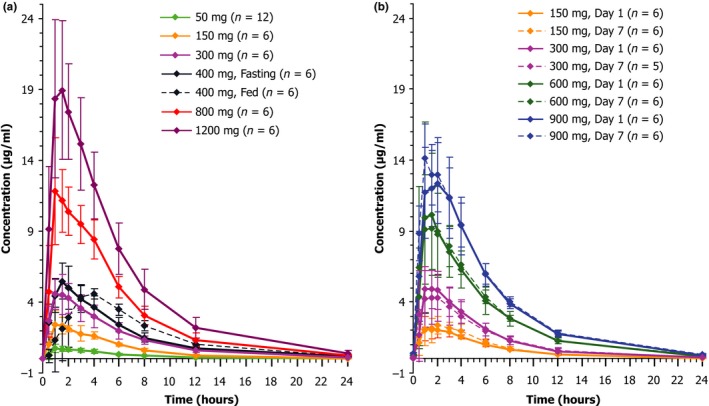
NYX‐2925 exposures over time. Mean plasma concentration profile of NYX‐2925 (linear scale) — (a) single ascending dose groups; (b) multiple ascending dose groups, day 1 and day 7. The error bars represent SD.
Official websites use .gov
A
.gov website belongs to an official
government organization in the United States.
Secure .gov websites use HTTPS
A lock (
) or https:// means you've safely
connected to the .gov website. Share sensitive
information only on official, secure websites.
NYX‐2925 exposures over time. Mean plasma concentration profile of NYX‐2925 (linear scale) — (a) single ascending dose groups; (b) multiple ascending dose groups, day 1 and day 7. The error bars represent SD.