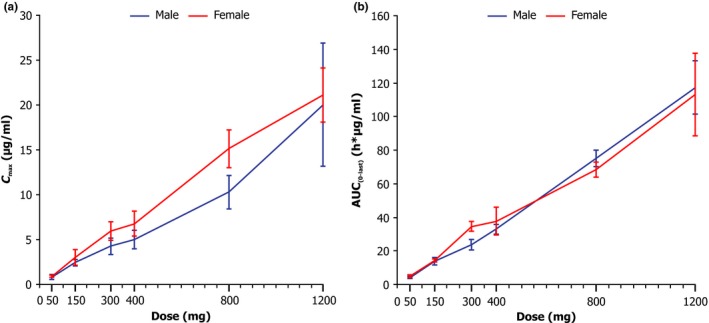
Figure 3.

Dose proportionality plot by gender and dose (single ascending dose groups) of (a) maximum plasma concentration (Cmax) and (b) area under the plasma concentration‐time curve from 0 to last collection time after drug administration (AUC 0‐last). The error bars represent SD.
