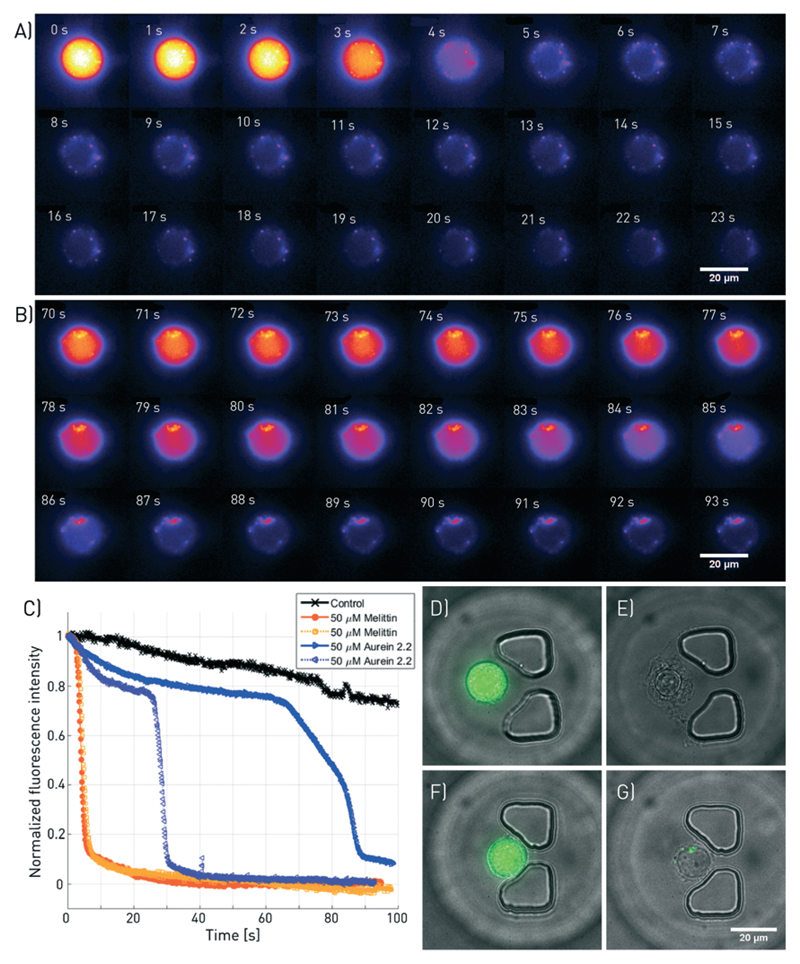
Fig. 2.
Fluorescence microscopy of melittin and aurein 2.2-induced membranolysis at high temporal and spatial resolution. A subset of the images taken at a frequency of 10 Hz and 100× magnification are shown for A) 50 μM melittin and B) 50 μM aurein 2.2. C) Fluorescence intensity decrease of four individual cells treated with melittin and aurein 2.2 (2 each) as well as a negative control without ACP. D) to G) Overlaid bright-field and fluorescence images of the cells, taken before and after the treatment. D and E correspond to the cell shown in A, and F and G depict the cell presented in B. The corresponding videos can be found in ESI† SV2.

