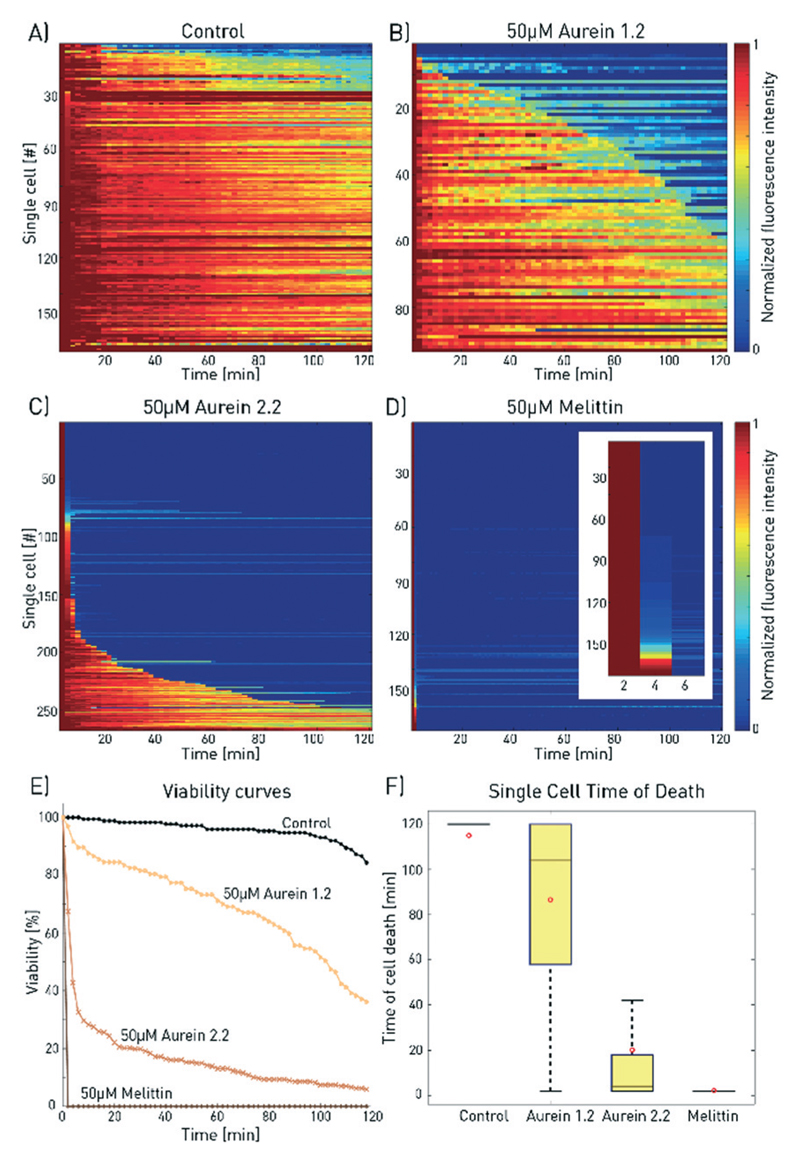
Fig. 3.
Comparison of the effect of melittin, aurein 2.2 and aurein 1.2 on MCF-7 cells. The 2D-matrix plots show the results for A) a control experiment and for 50 μM B) aurein 1.2, C) aurein 2.2 and D) melittin (the inset shows a zoom for the first 6 min). Every horizontal line depicts the viability of a single cell over time, whereby cells are alive at high fluorescence intensity and dead at low fluorescence signal (total number of analysed cells: nA = 170, nB = 97, nC = 267, and nD = 364). E) The time until membrane disruption differs for each of the peptides as depicted by the combined single-cell measurements. F) For aurein 1.2, this time period is distributed much wider than those for aurein 2.2 and melittin, underlining the heterogeneous cell response. For improved visibility, outliers are not shown and mean values are marked by red circles.

