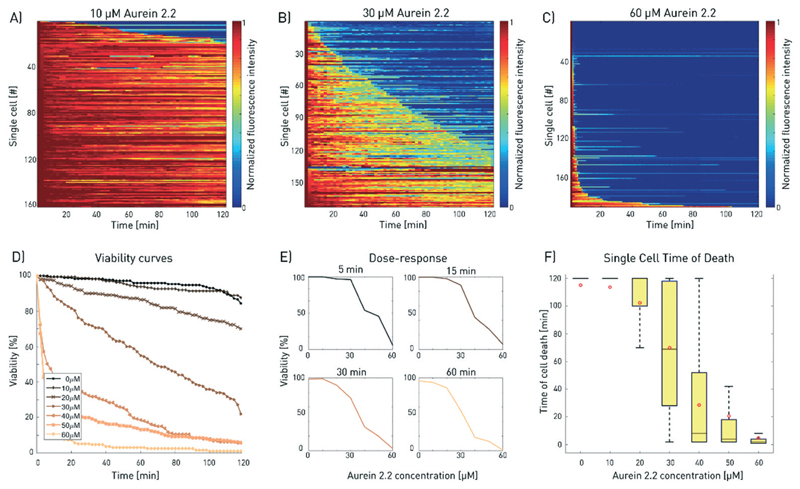
Fig. 4.
Dose–response analysis for aurein 2.2. A–C) Increasing aurein 2.2 concentrations induced faster cell death. The results for three different concentrations of aurein 2.2 are shown exemplarily (total number of analysed cells: nA = 163, nB = 173, nC = 190; for all 2D plots, refer to ESI† S10). The single-cell measurements were combined to plot D) the viability of the cell population over time for increasing doses and E) the drug response curves for selected time points during the measurement. F) The time of cell death is evaluated for increasing aurein 2.2 concentrations. Higher concentrations show faster mean cell death but broad variations are found for the intermediate concentrations (30 and 40 μM). The red dots depict the mean value of the corresponding measurements, outliers are not shown for better visibility. Differences between the mean and median are a consequence of the non-Gaussian distribution of the data. This results from the fact that the measurement duration was limited to 120 min.

