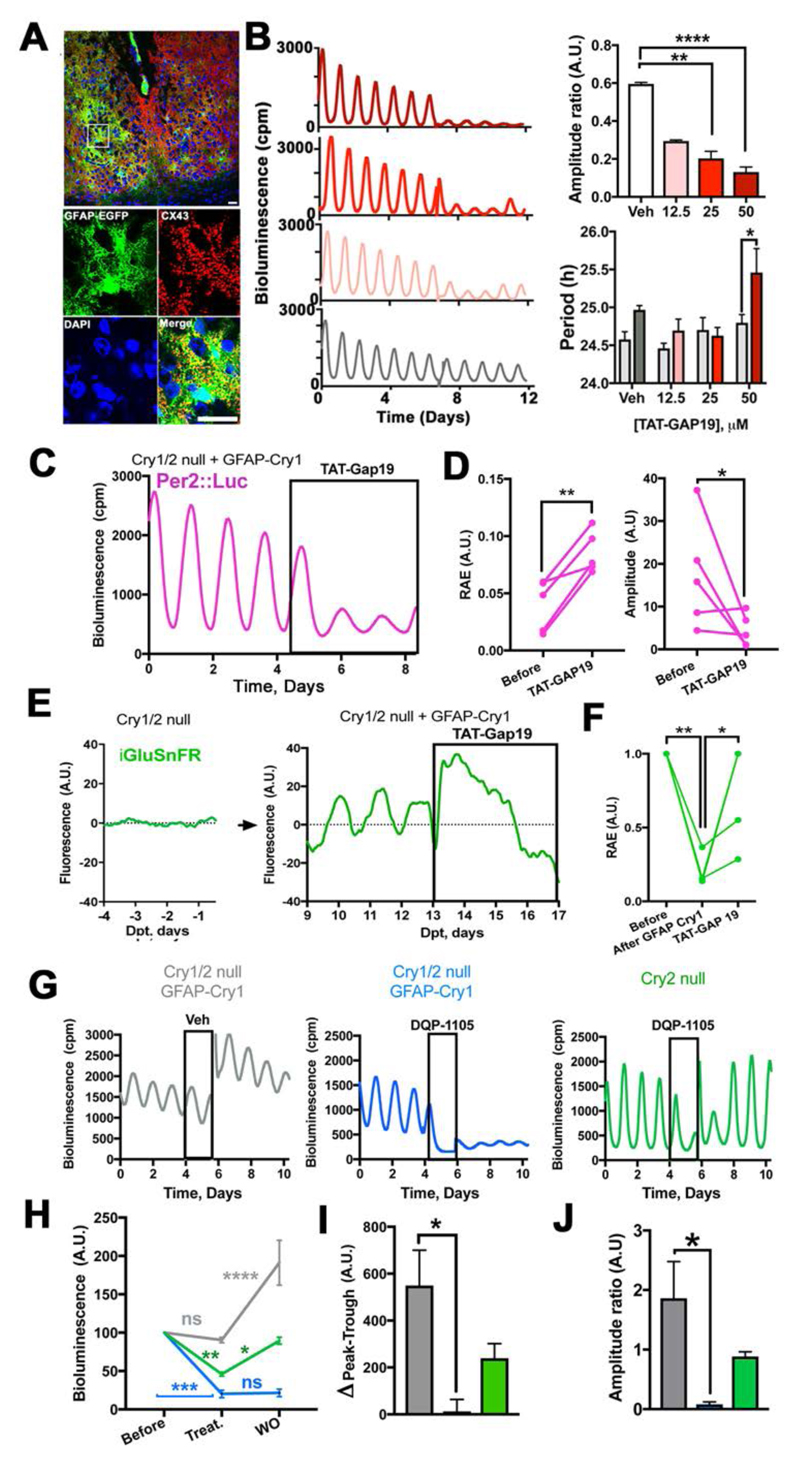
Fig. 4. Astrocytically released glutamate mediates astrocytic control of circuit-level circadian time-keeping in Cry1/2-null SCN expressing GFAP-restricted Cry1.
(A) Confocal tiled microphotographs of adult SCN showing co-localization of GFAP-EGFP and Cx43, detected by polyclonal antiserum (representative of 3 independent brains). (B) Representative Per2::Luc PMT traces and group data (Mean+SEM) showing dose-response effects of TAT-Gap19 on amplitude (ratio= with drug/before drug) and period in wild type SCN slices. Statistical test: Amplitude ratio= unpaired ANOVA, with a Bonferroni correction. Period is 2-way RM-ANOVA, with a Bonferroni correction, n=3 for each group, except Veh n=4. (C, D) Representative Per2::Luc PMT trace (C) and paired scatter plot of RAE and amplitude (D) of Cry1/2-null SCN slices transduced with GFAP-mCherry::Cre and Cry1-Flex-Cry1::EGFP and treated with TAT-Gap19 (50 μM). Statistical test: paired one-tailed t-test, n=5. (E, F) Representative iGluSnFR traces (E) and paired scatter plot of RAE (F) of Cry1/2-null SCN slices before and after GFAP-mCherry::Cre/ Cry1-Flex-Cry1::EGFP transduction and with TAT-Gap19 (50 μM). Statistical test: RM-ANOVA, with a Bonferroni correction, n=4. (G) Representative Per2::Luc PMT traces of Cry2-null and Cry1/2-null SCN slices transduced with GFAP-mCherry::Cre and Cry1-Flex-Cry1::EGFP on treatment with DQP-1105 (50 μM) or vehicle, and subsequent washout. (H) Group data (Mean+SEM) of bioluminescence baseline traces represented in (G) before, in the presence of, and after removal of, DQP-1105. Statistical test is 2-ways RM-ANOVA, with a Bonferroni correction. (I) Group data (Mean+SEM) showing peak-trough difference in the presence of DQP-1105 of traces represented in (G). (J) Group data (Mean+SEM) showing amplitude (ratio= after drug/with drug) of data presented in (G) Statistical test in (H) is 2-ways RM-ANOVA, with a Bonferroni correction. Statistical test in (I) and (J) is unpaired ANOVA, with a Bonferroni correction; n=4 for Cry2-null and Veh groups; n=3 for DQP-1105 in Cry1/2-null group *=p<0.05; **=p<0.01; ***=p<0.001; ****=p<0.0001, n=4. Scale bars= 20 μm.

