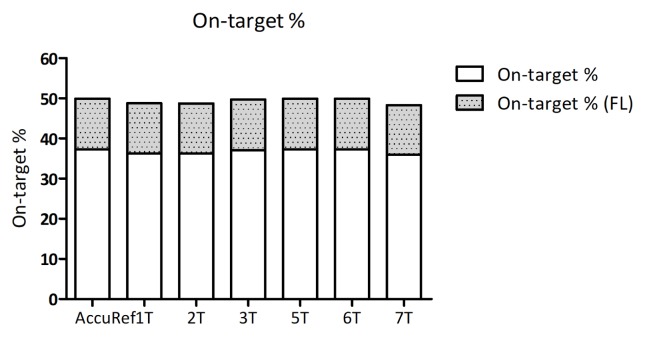
Fig. 2.
Grouped histogram of on-target rate (%). On-target rate was expressed using the stacked histogram. The x-axis shows 6 tumor samples and one positive control. The upper part of each bar shows on-target % when the target region is enlarged with additional 50-bp flanking parts on both sides of each region.

