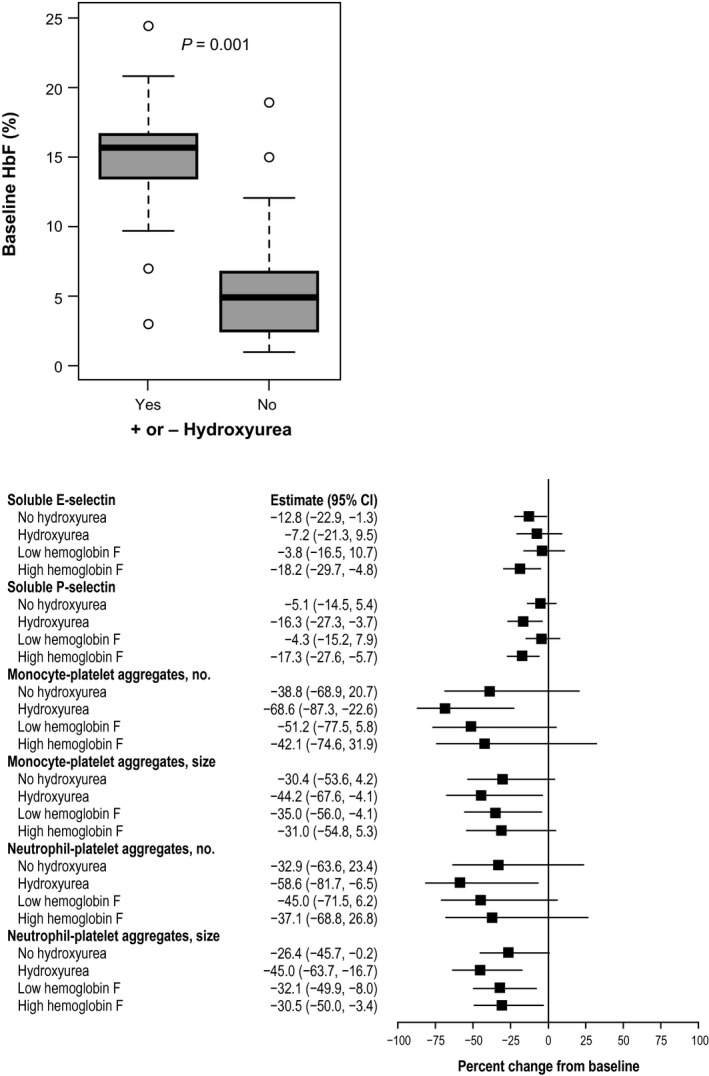
Figure 4.

Analysis of biomarkers by hydroxyurea (HU) use and fetal hemoglobin (HbF) levels. (a) Box and whiskers plot of HbF baseline levels (%) in patients (n = 27) with and without HU treatment. Boxes present area between 25th and 75th percentile values. Whiskers extend 1.5 of interquartile range from the box. Line within each box is the median value. The circles represent individual observations that could be considered outliers. (b) The percent changes from baseline at day 29 for biomarkers in subgroups of patients (PF‐04447943 25 mg twice daily), with vs. without HU cotreatment, and low vs. high baseline HbF levels. Low HbF levels were defined as < 10%, and high baseline HbF levels were 10% or higher, based on median of the sample distribution. Forest plot presents estimates and 95% confidence intervals, based on repeated measures model.
