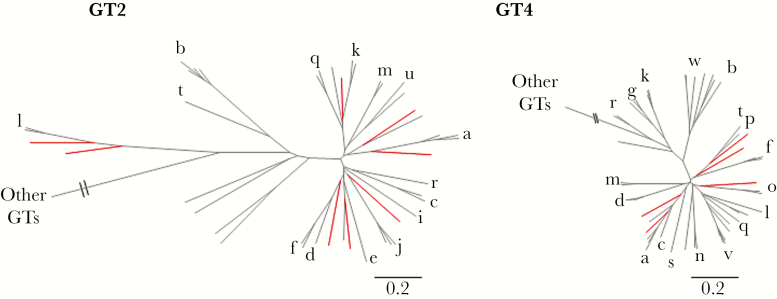
Figure 2.
Phylogenetic analysis of genotype 2 and genotype 4 subtypes. Individual maximum likelihood trees were inferred for each genotype, including all previously described confirmed and unassigned subtypes. Previously described subtypes are shown in black, with a corresponding letter for the confirmed subtypes and no letter for the unassigned subtypes. The novel subtypes are shown in red. For genotype 2, 15 confirmed and 8 unassigned subtypes previously described were included. For genotype 4, the 18 confirmed and 10 unassigned subtypes were included in the tree.

