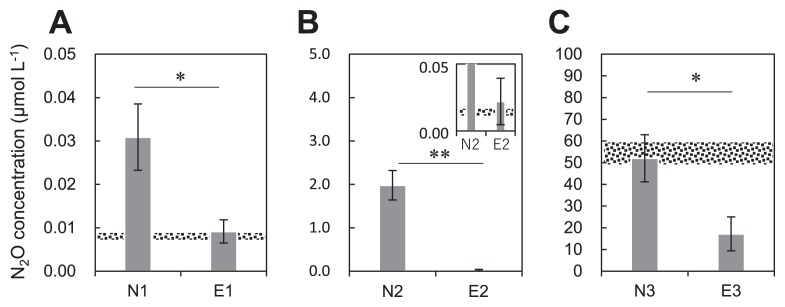
Fig. 1.
Concentrations of N2O in the headspace of bottles after a 7-d incubation. (A) Sediments incubated without NH4Cl or N2O in the non-eelgrass zone N1 and eelgrass zone E1. (B) Sediments incubated with NH4Cl in the non-eelgrass zone N2 and eelgrass zone E2. (C) Sediments incubated with N2O in the non-eelgrass zone N3 and eelgrass zone E3. Error bars indicate the standard deviation (n=3 biologically independent samples). * shows a significant difference (*, P<0.05; **, P<0.005). The gravel zone (at approximately 0.007 μmol L−1, and approximately 55 μmol L−1) shows the initial concentrations of N2O in the headspace of bottles.

