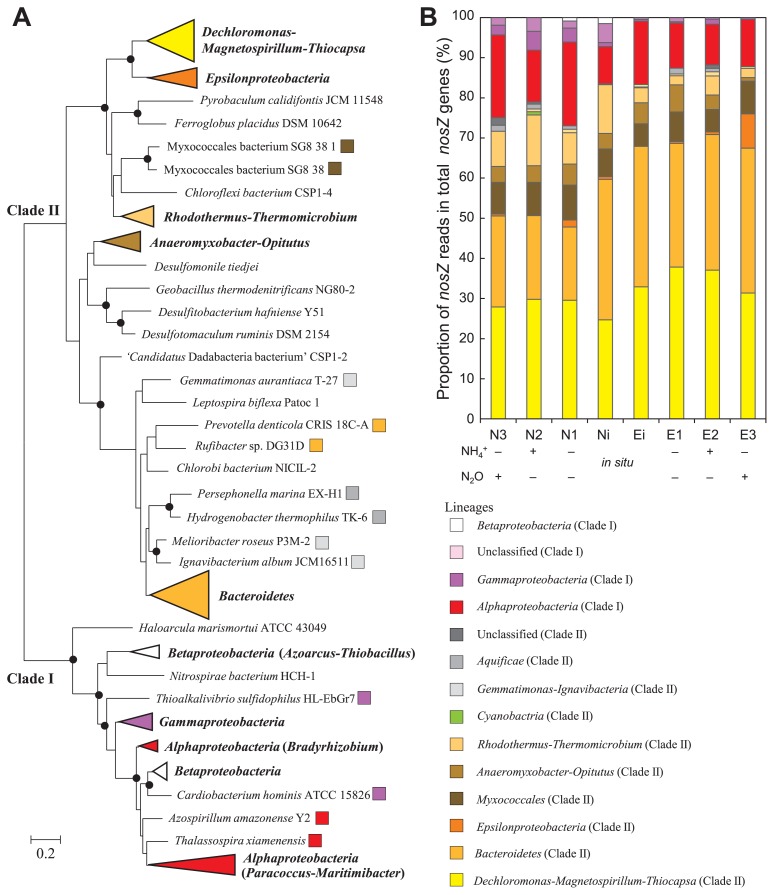
Fig. 3.
Bootstrapped maximum likelihood tree (A) and average relative abundance of nosZ genes (B). The tree was built from 138 archetype amino acid sequences. Branches with bootstrap support of more than 70% are revealed by closed circles. The scale bar represents an estimated sequence divergence of 20%. Data represent the mean of biologically independent samples (n=3). Only N1 is shown (n=1), and only N3 is shown (n=2).

