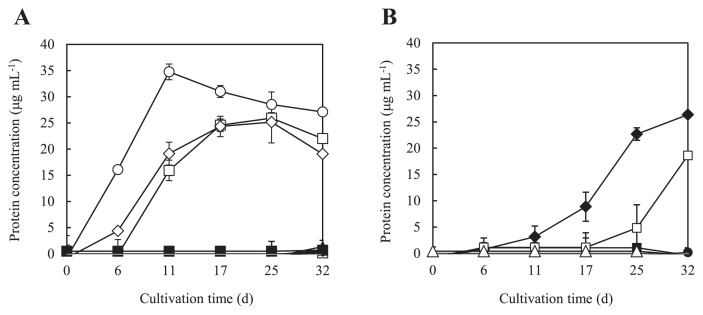
Fig. 2.
Growth curves of strain PE-TB08W using various growth substrates. The longitudinal axis indicates protein concentrations (μg mL−1) using the Lowry method. The horizontal axis indicates cultivation times (d). Results are plotted as the mean values obtained for at least two experiments. Error bars represent the range of individual points. (A) Assimilation of gaseous hydrocarbons: (●), Methane; (■), Ethane; (▲), Propane; (◆), Ethylene; (○), Propylene; (□), n-butane; (△), i-butane; (⋄), 1-butene; (▼), cis-2-butene; (▽), trans-2-butene; (×), control (no gaseous hydrocarbon substrate added). (B) Assimilation of alcohols: (●), Methanol; (■), Ethanol; (▲), Acetone; (◆), 1-propanol; (○), 2-propanol; (□), 1-butanol; (△), 2-butanol; (⋄), Pentane; (×), control (not alcohol added as a substrate).

