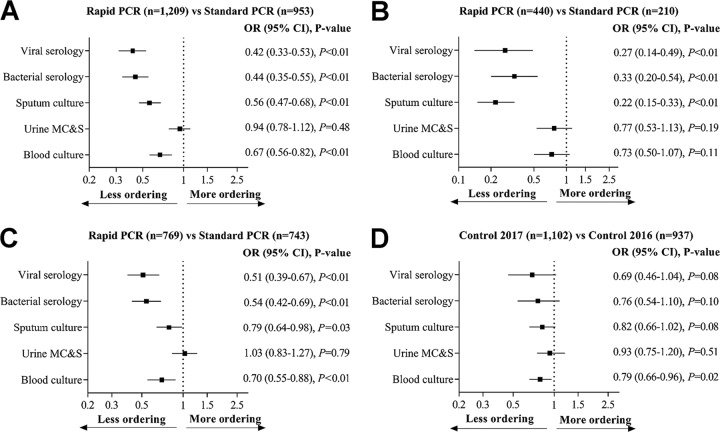
FIG 2.
Common microbiology test utilization. (A) Regardless of test results, (B) positive test results, (C) negative test results, and (D) control groups. The middle square shows the odds ratio (OR), and the horizontal line shows the 95% confidence interval (CI) of the OR. The inclusion of “1” in the 95% CI indicates a nonsignificant difference in the ordering practices between groups. All analyses were adjusted for baseline variables, including age, study hospital, the source of referral, intensive care admission status, mode of separation, Charlson comorbidity index, and type of principal diagnosis. MC&S, microscopy, culture, and sensitivity.

