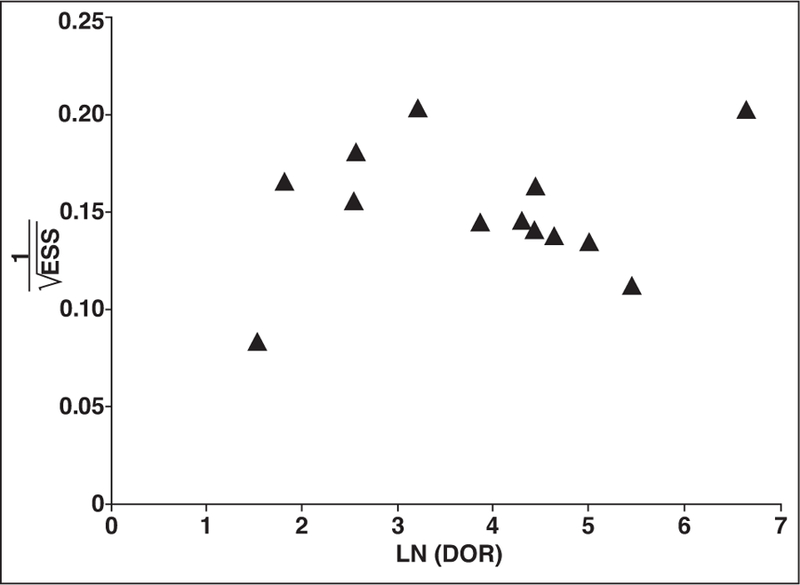
Fig. 2—

Deeks funnel plot for assessment of publication bias, plotting log (LN) diagnostic odds ratio (DOR) against reciprocal of square root of effective sample size (ESS). Each marker represents one study included in meta-analysis. Studies with more than one technique analyzed for differentiation of papillary renal cell carcinoma from other lesions are represented only once, with preference for contrast-enhanced characteristics as technique for differentiation.
