
Fig. 4— Sensitivity and specificity of seven studies that assessed relative tumor contrast enhancement for differentiation of papillary renal cell carcinoma (RCC) from other types of renal tumors.
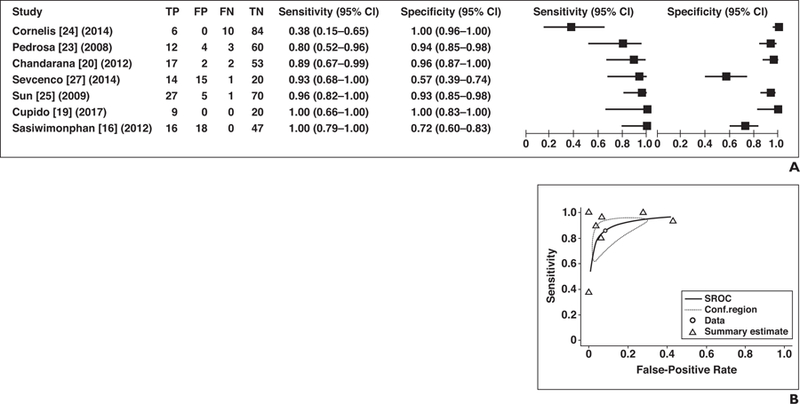
A, Forest plot of sensitivity and specificity for investigated studies. Each study is identified by name of first author, reference number, and year of publication. Squares represent point estimates, and horizontal lines represent 95% CIs for sensitivity and specificity. True-positive (TP), false-positive (FP), false-negative (FN), and true-negative (TN) data are reported as number of lesions.
B, Summary ROC (SROC) curve of seven studies that included relative tumor contrast enhancement for differentiation of papillary RCC from other renal tumors. Area under SROC curve was 0.894. Conf.region = confidence region.