
Fig. 6— Sensitivity and specificity of studies that assessed signal loss on opposed-phase imaging for differentiation of papillary renal cell carcinoma (RCC) from other types of renal tumors.
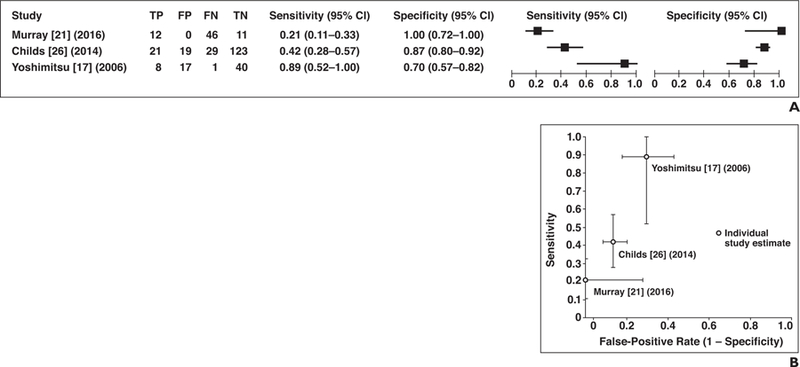
A, Forest plot of sensitivity and specificity for investigated studies. True-positive (TP), false-positive (FP), false-negative (FN), and true-negative (TN) data are reported as number of lesions.
B, Plot of included studies in ROC space shows studies that assessed signal loss on opposed-phase imaging for identification of papillary RCC. Dots represent sensitivity and false-positive rate reported in each study and lines represent 95% CI.